Create a survey
Surveys help collect valuable user feedback about company activities to improve the quality of goods or services. With SendPulse, you can create surveys on your website using pop-ups.
In this article, we will talk about how to create a survey and view its results.
Create a pop-up survey
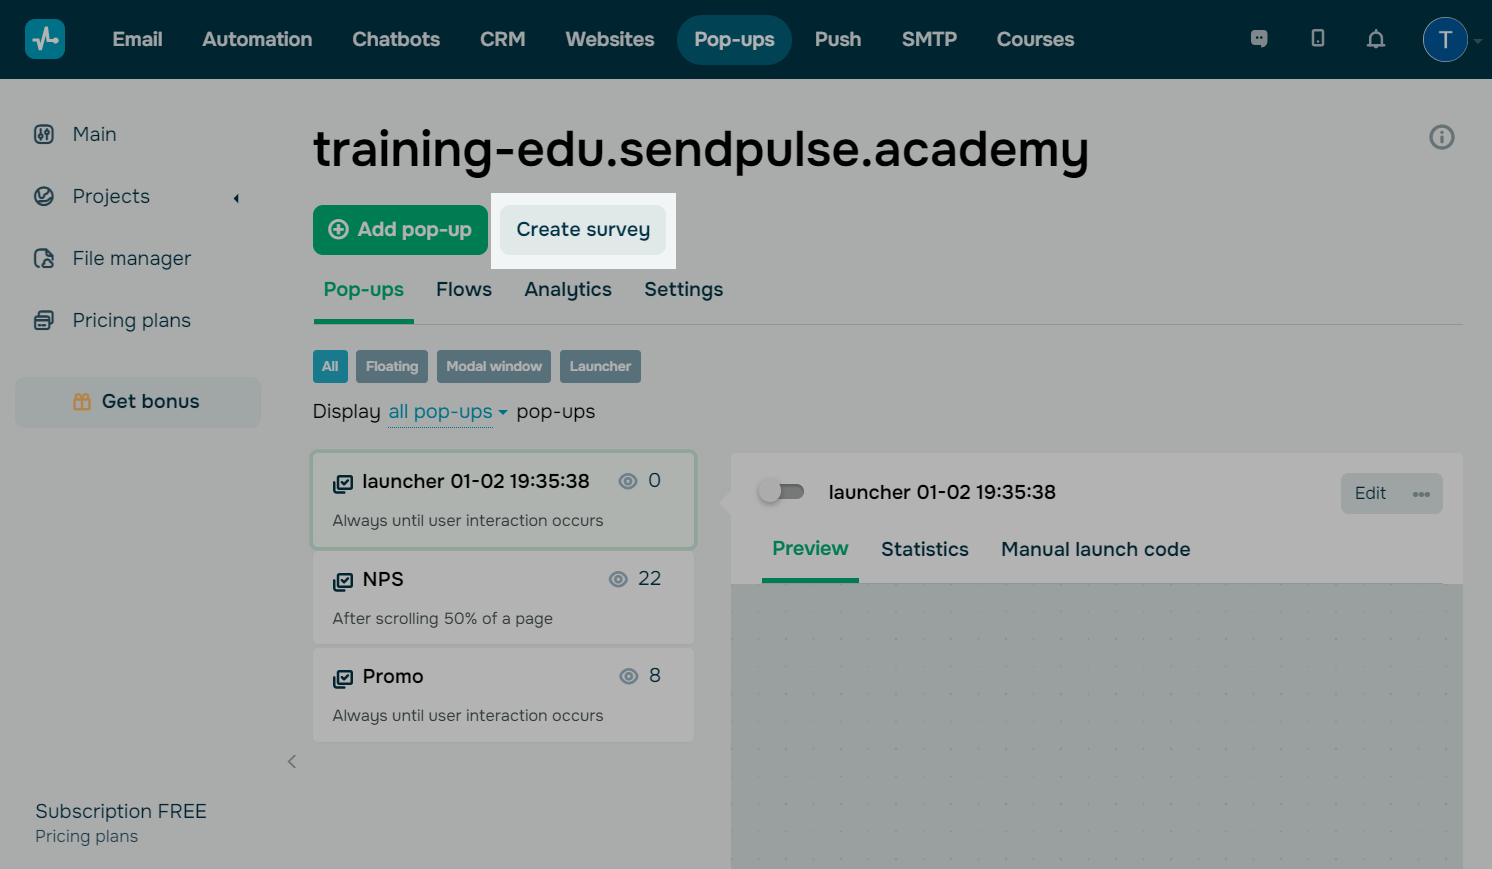
Go to your website and click Create survey.
Select a pop-up type. Then, choose a template from the list or create a pop-up from scratch.
Add survey steps
Surveys consist of several linked pop-ups that appear one after another based on user actions defined in the settings. Every pop-up is called a “step” in the builder, and you can add them according to your scenario or the number of questions.
Outline your goal, draft a list of questions and possible answers, and organize them before creating your survey. We also recommend informing website visitors about the purpose of your survey and how you intend to use their data, thanking them for completing your survey at the end.
By default, surveys have two steps. To add a new step, click + on the top panel.
To rearrange your steps, drag them with your left mouse button. The number of steps will adjust automatically based on the new order.
To delete a step, click x.
Customize your survey content
Switch between the steps to add elements, and customize them on the right settings panel.
Add elements
In the Elements tab, you can add a cover image and survey elements.
Your background image will be applied to all steps.
You can use elements like Text, Entry field, Multiselect, Checkbox, NPS survey, and more.
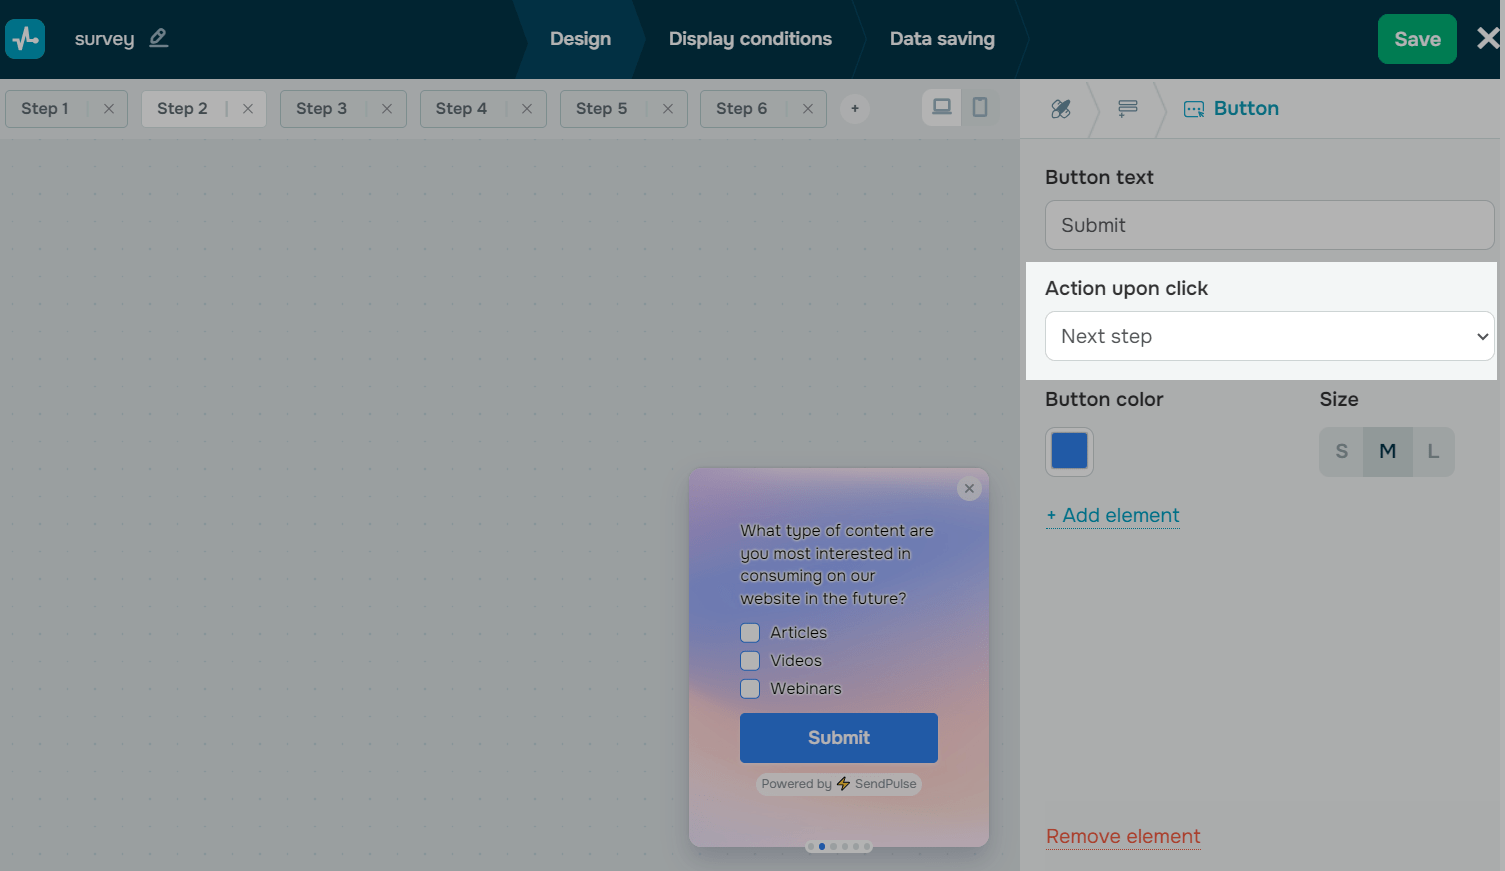
To enable users to navigate between steps, add the Button element. Select Next step in the Action upon click field.
Customize pop-ups
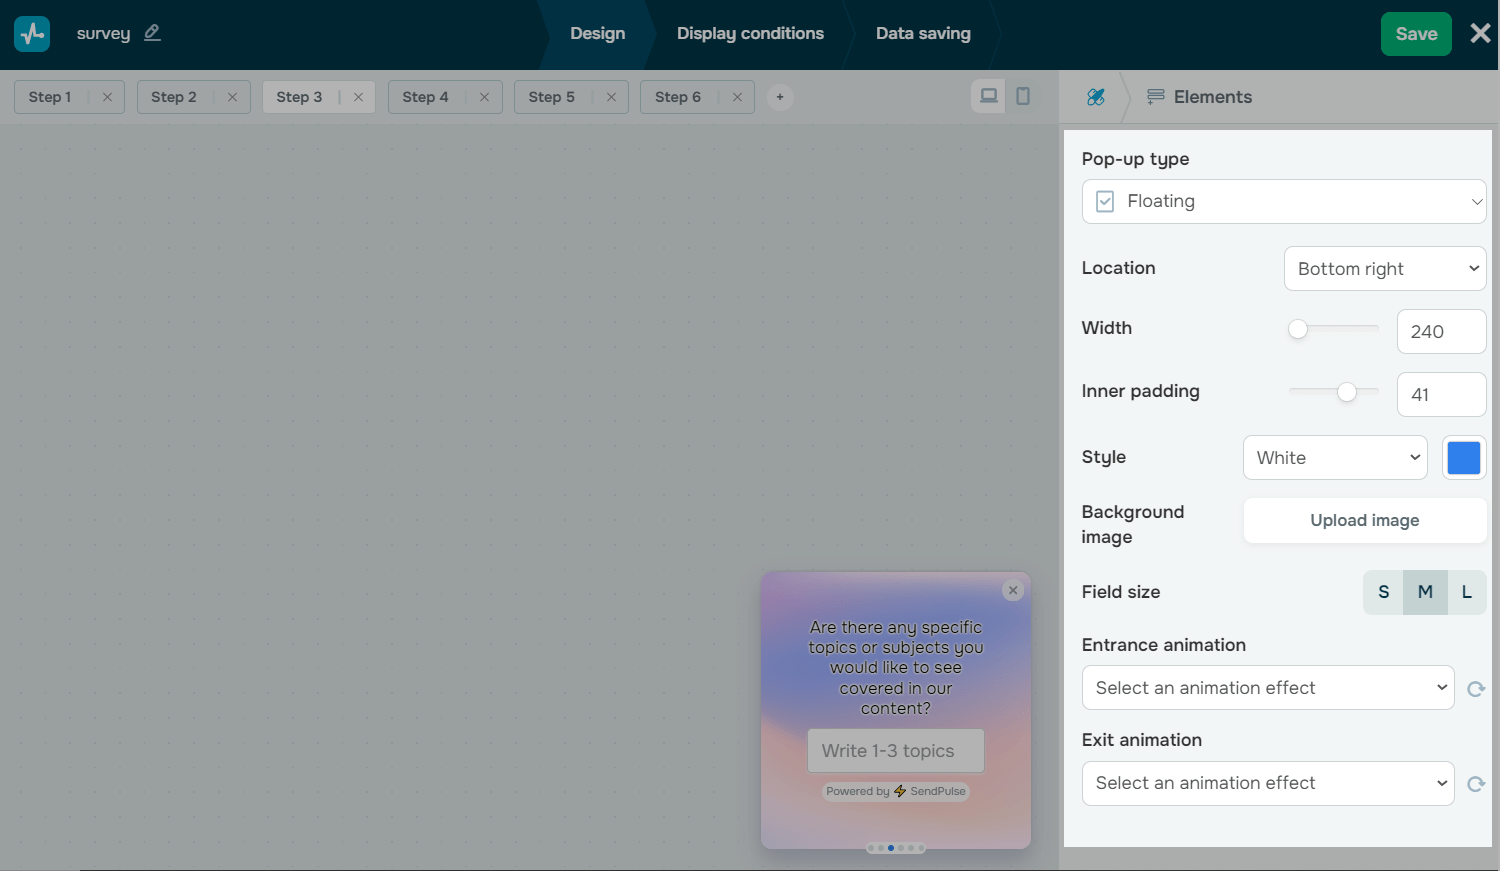
Go to the Style tab to customize your pop-ups' appearance.
You can select a pop-up type and placement, adjust the width and padding, select a background, colors, size, and set up effects.
Once you configure all the settings, click Next.
Continue setup
After customizing your pop-up design, click Next.
In the Display conditions tab, choose when and how the widget will appear.
In the Data saving tab, select where to store subscriber data in other services.
Once you're done, click Save and publish or Save and close.
Once you finish creating, go to the Pop-ups section to preview the pop-up, track stats, and edit any settings.
Use a survey landing page
When you create a pop-up survey, the system automatically generates a landing page for it in the Websites section. This page already includes your survey and is accessible through a direct link.
View your survey results
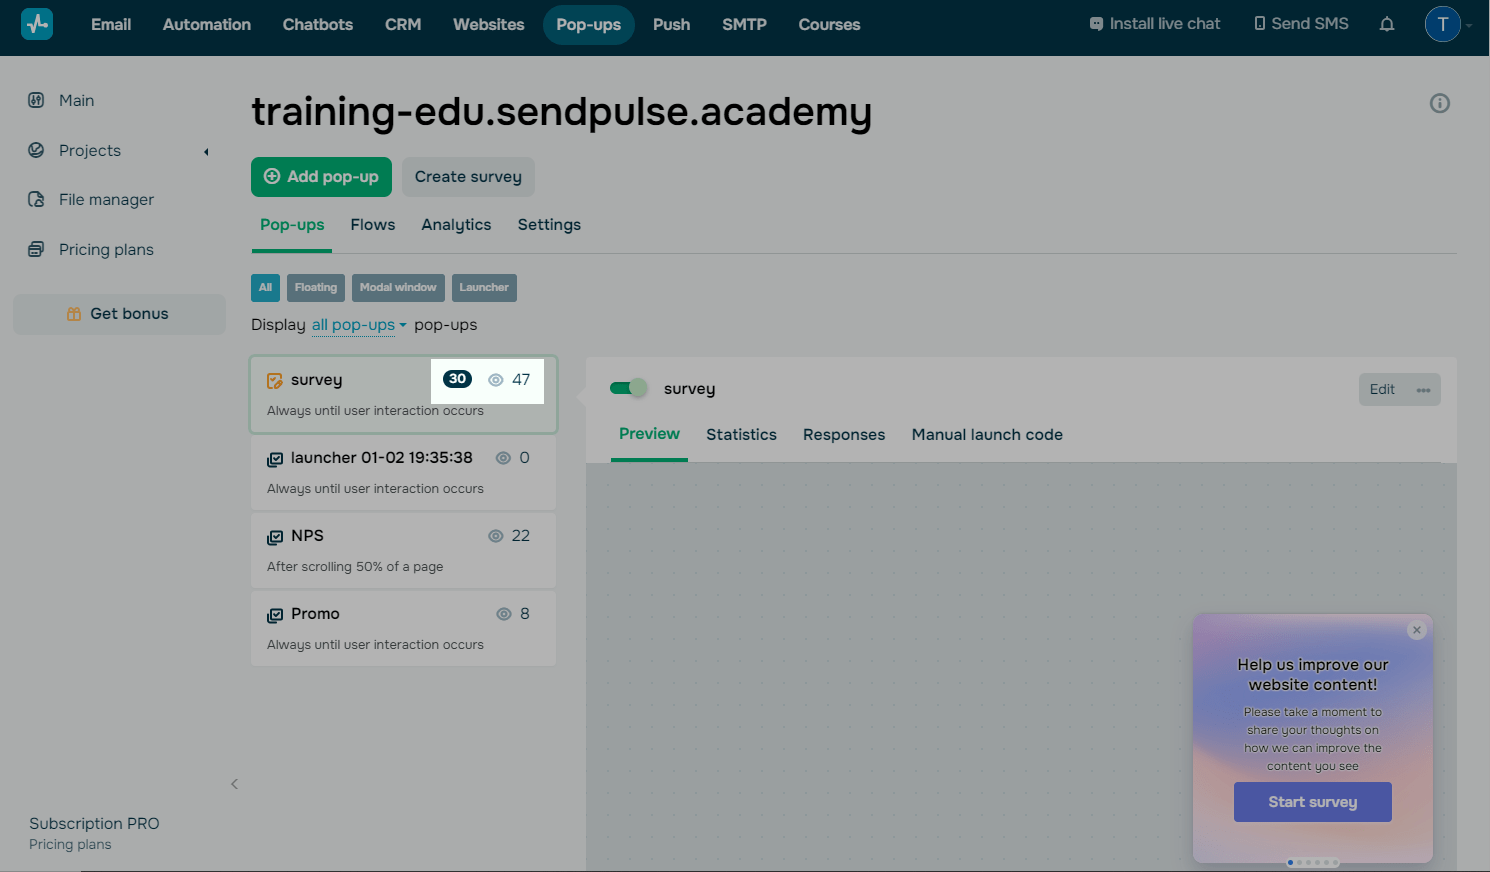
To view the results, go to your project, and click the survey. The total number of replies and views will be displayed next to the survey name.
In the Statistics tab
Go to the Statistics tab, and select a data display period. On the chart, you will see the following indicators:
- views;
- button clicks;
- pop-up exits;
- leads (users who shared their contact information).

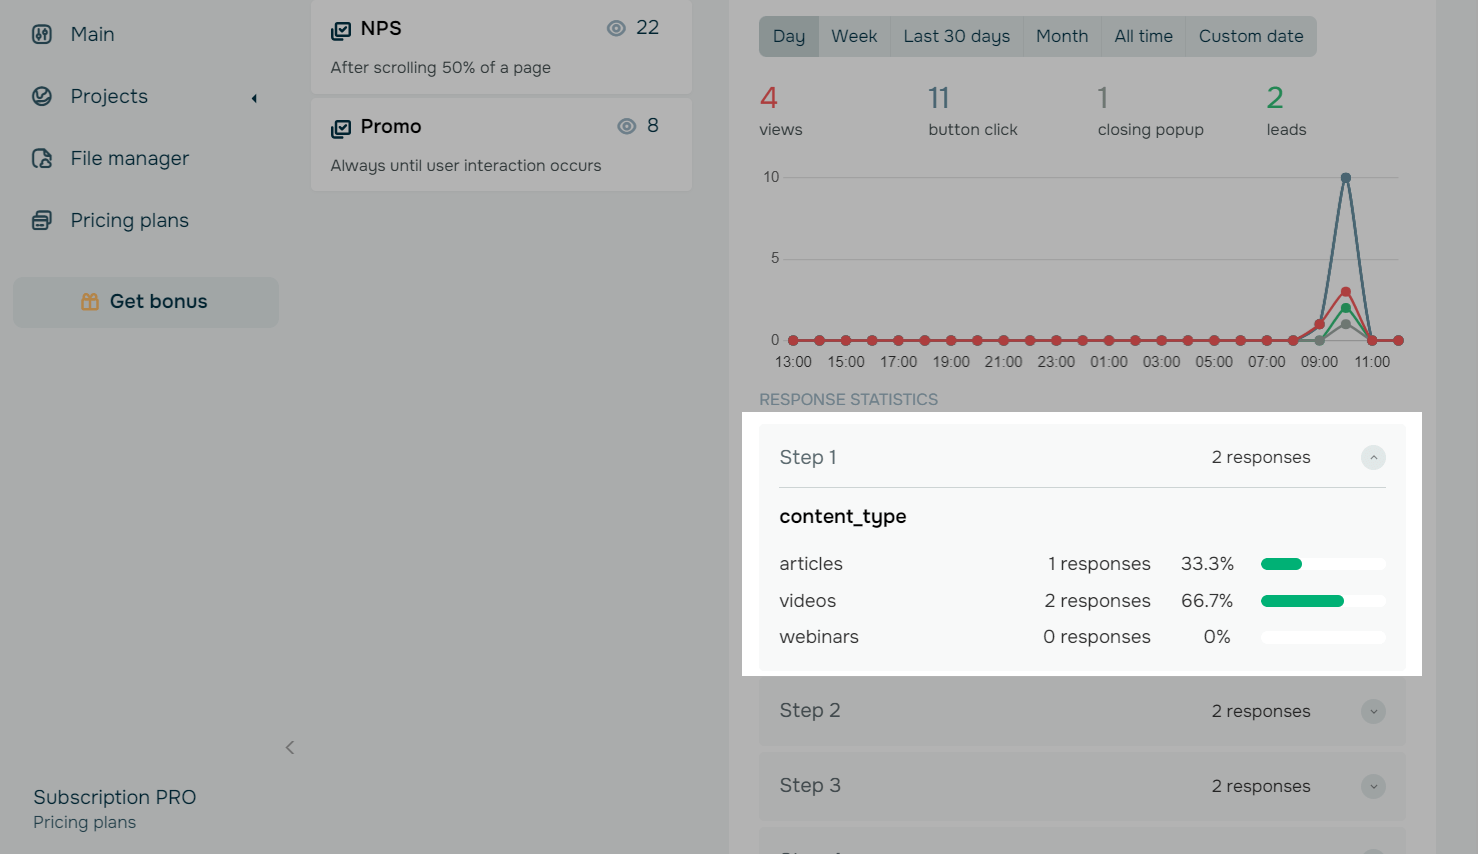
Below you will see every survey step’s statistics and the most commonly selected answer options.
To view your next steps’ statistics, click the arrow next to the step.
In the Responses tab
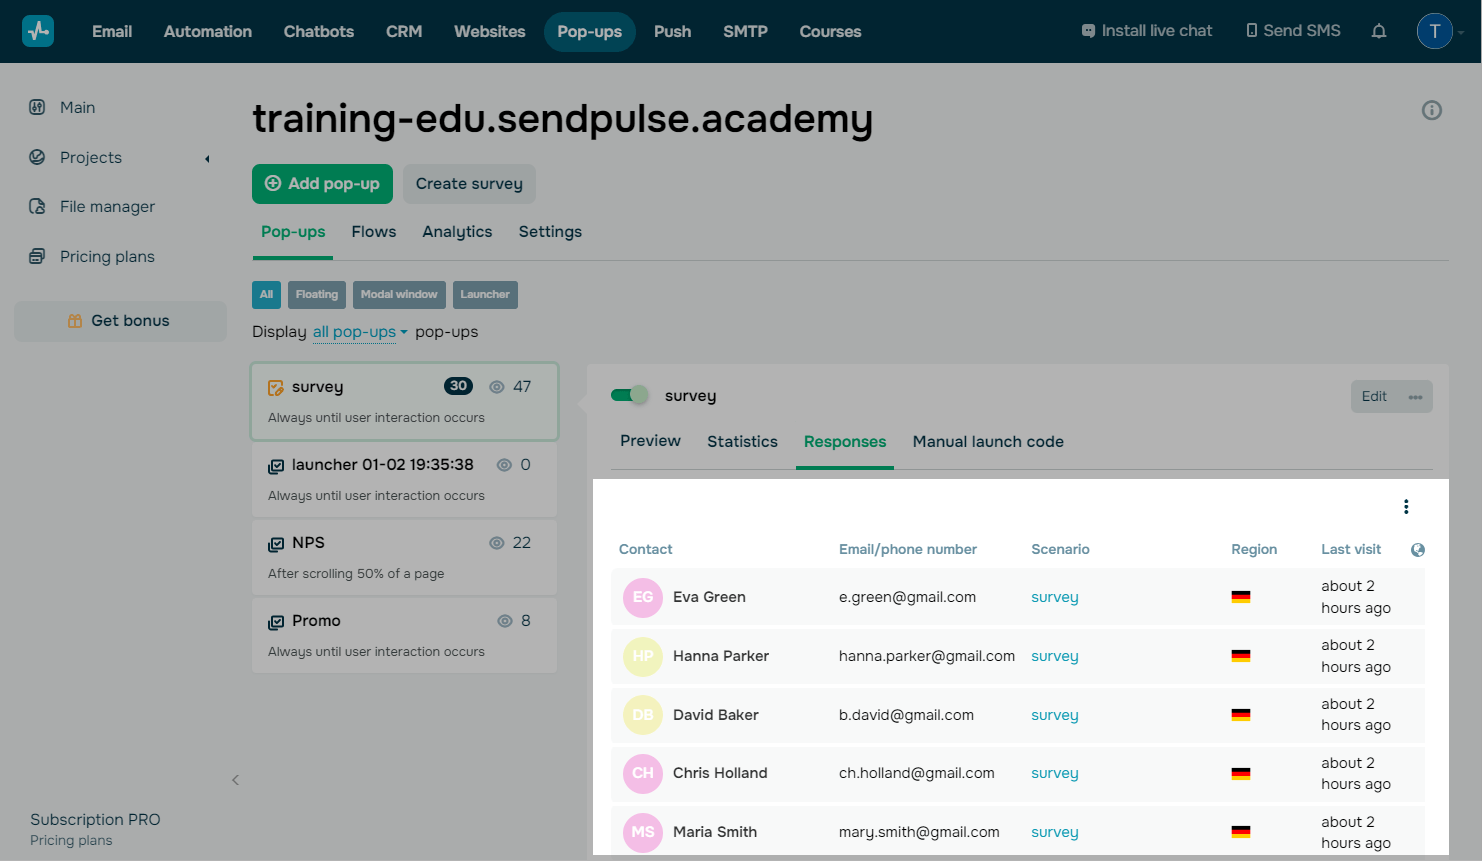
Go to the Responses tab to view the list of acquired leads.
In the table, you will see respondents’ names, email addresses or phone numbers, pop-up scenario names, and last visit time. If you have a paid pricing plan, you will also see users’ regions.
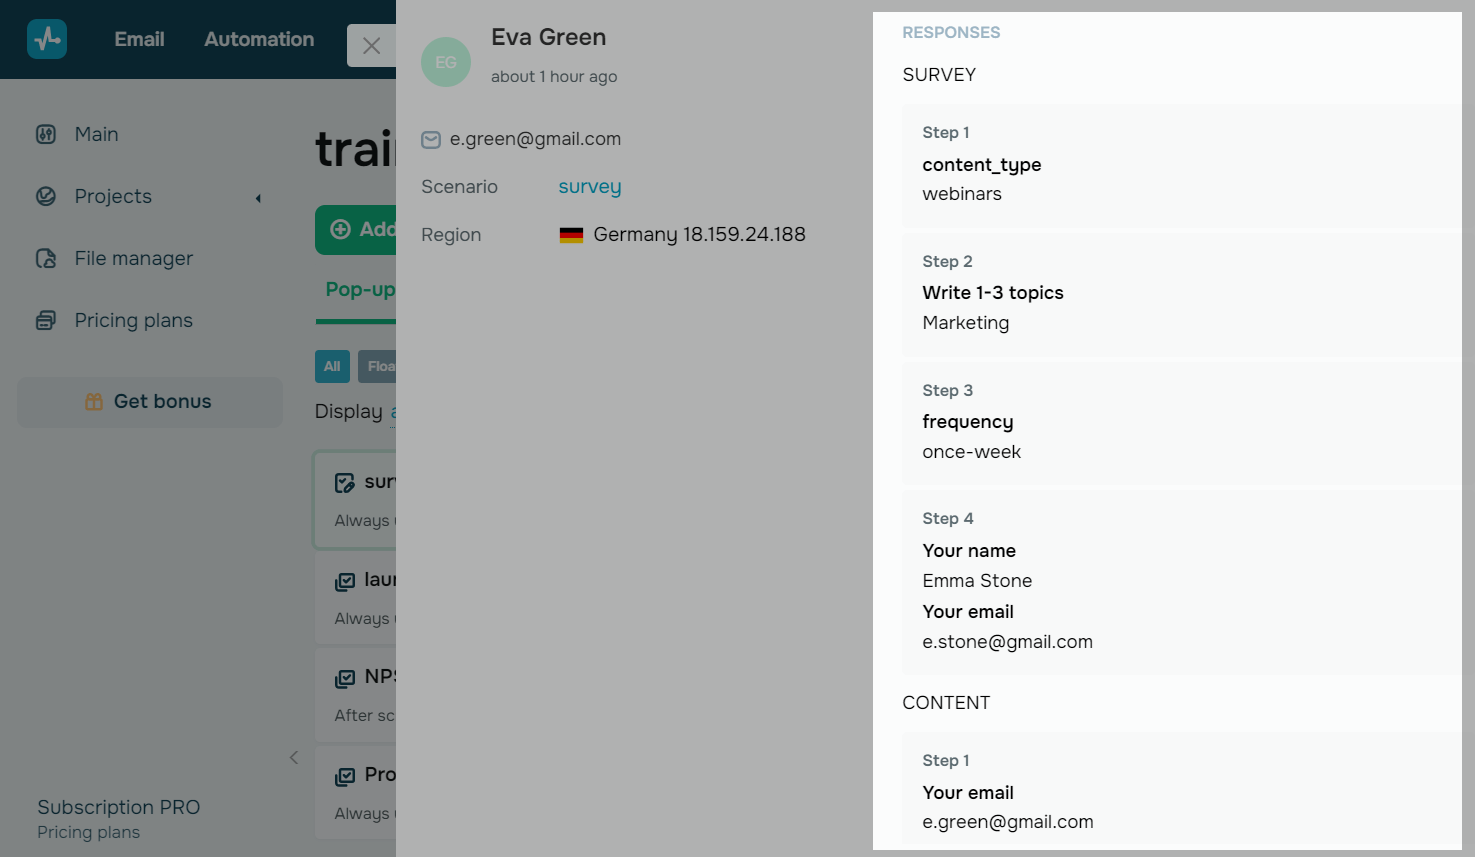
Click a respondent's name to view more data about their responses. On the left, you'll see their contact information, survey name, and region. On the right, you will see their responses at every survey step.
By default, the survey you're currently viewing statistics for is shown first. If you conducted multiple surveys and the respondent took part in more than one, their answers in different scenarios will be displayed below.
Read also: How to view your pop-up statistics.
Last Updated: 06.05.2025
or