View your automation statistics
Campaign statistics help businesses analyze the effectiveness of their customized flow scenario using various communication channels. With SendPulse, you can access detailed statistics with element and recipient data.
In this article, we will talk about how to view automation statistics.
View your flow list
Go to the Automation360 > Dashboard to view the list of automated flows you created. You can filter your automated flows by the criteria. To view the statistics of a specific automated flow, click it and go to the flow page.
View your flow statistics
Next to each flow name, you will see its general statistics.
| Subscribers in queue | The number of contacts waiting for an element to be executed. |
| Completed series | The number of contacts for whom your element execution script has been completed. |
| Conversions amount | The number of conversions. |
| Messages sent | The total number of sent messages in your flow. |
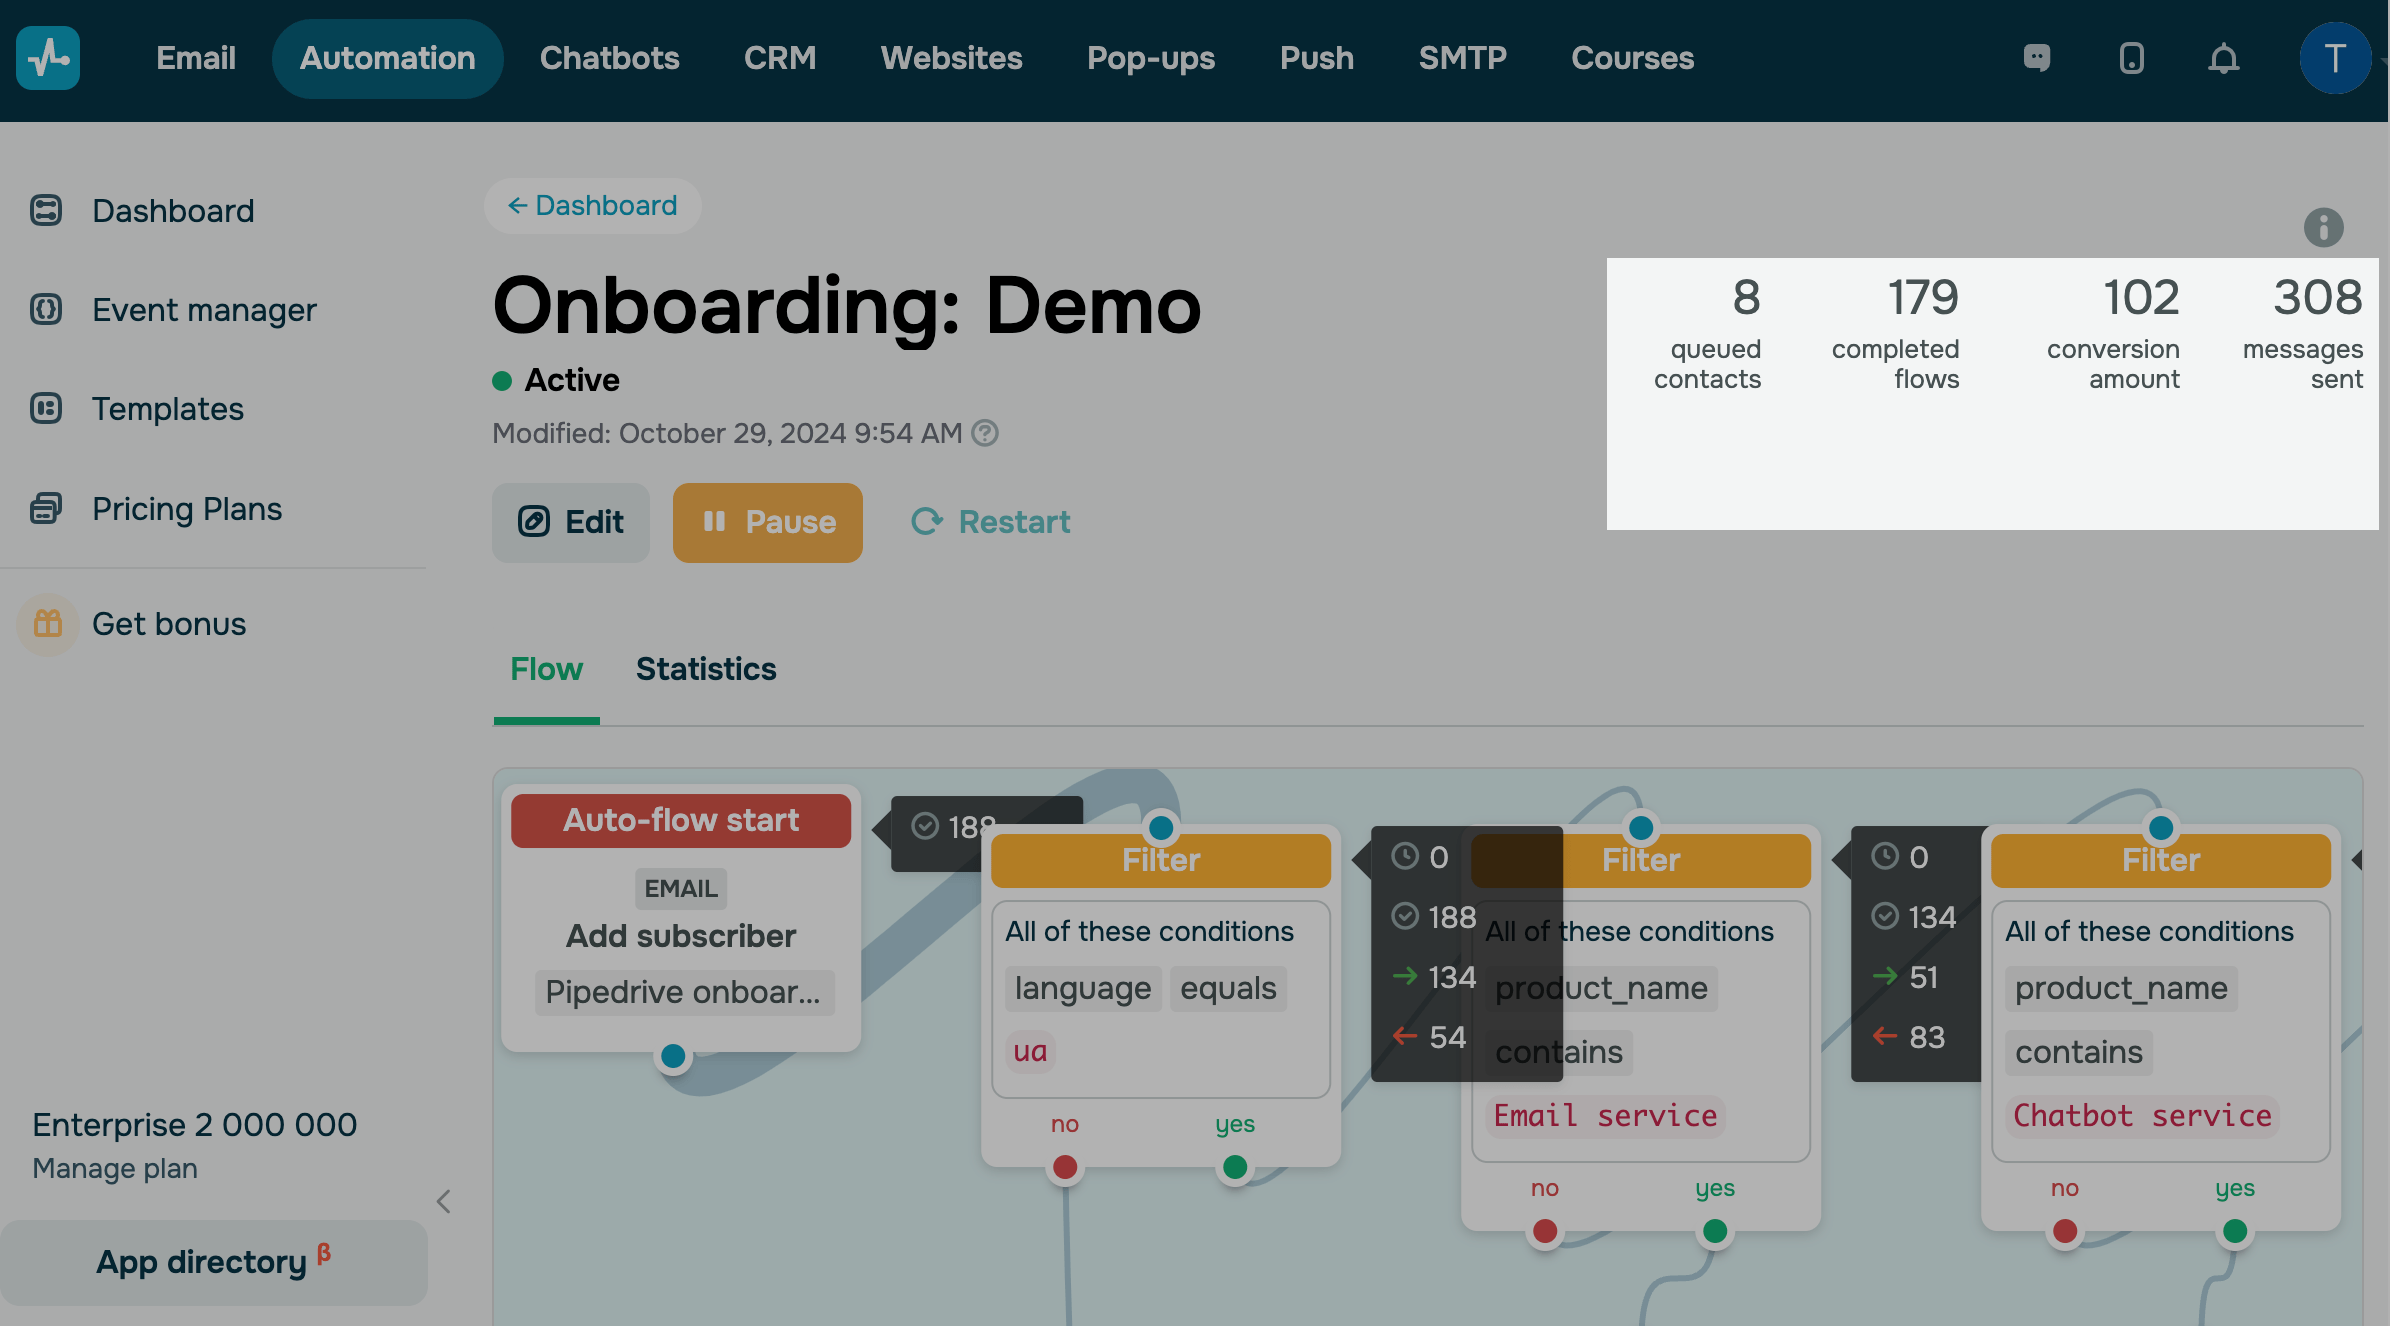
The Flow tab
In the Flow tab, you can view your flow structure and statistics for each element in it.
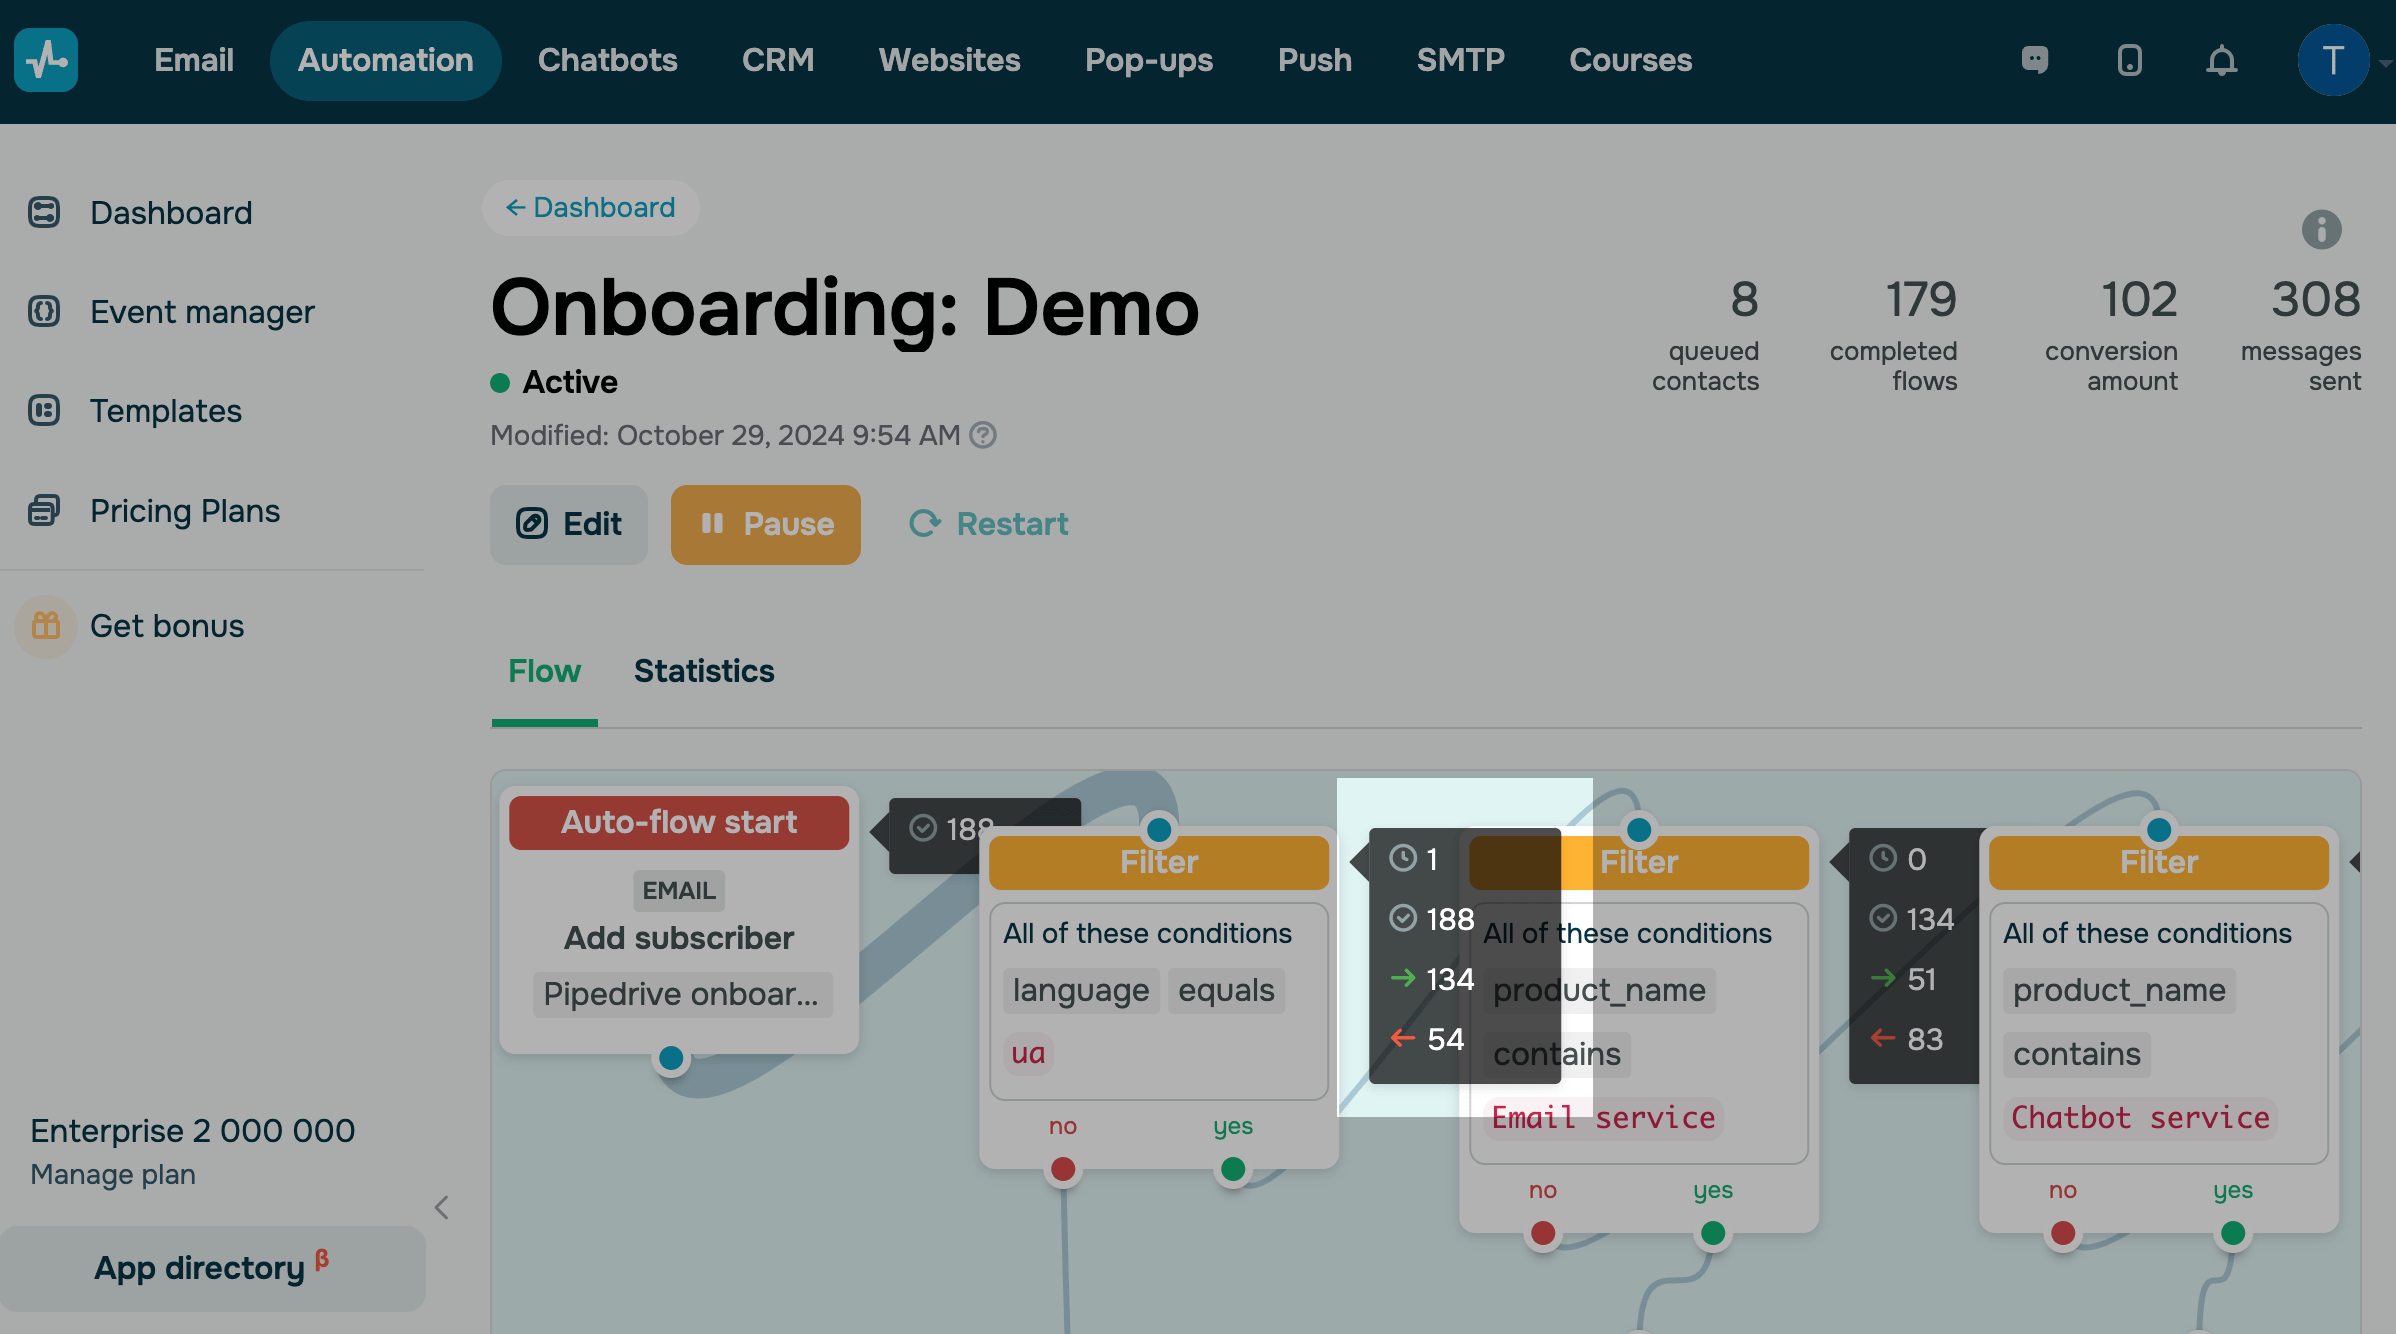
Hover over an element to see the number of contacts that reached it and view its execution status.
To view another flow part, hold down the left mouse button, and move the cursor around the area.
The Statistics tab
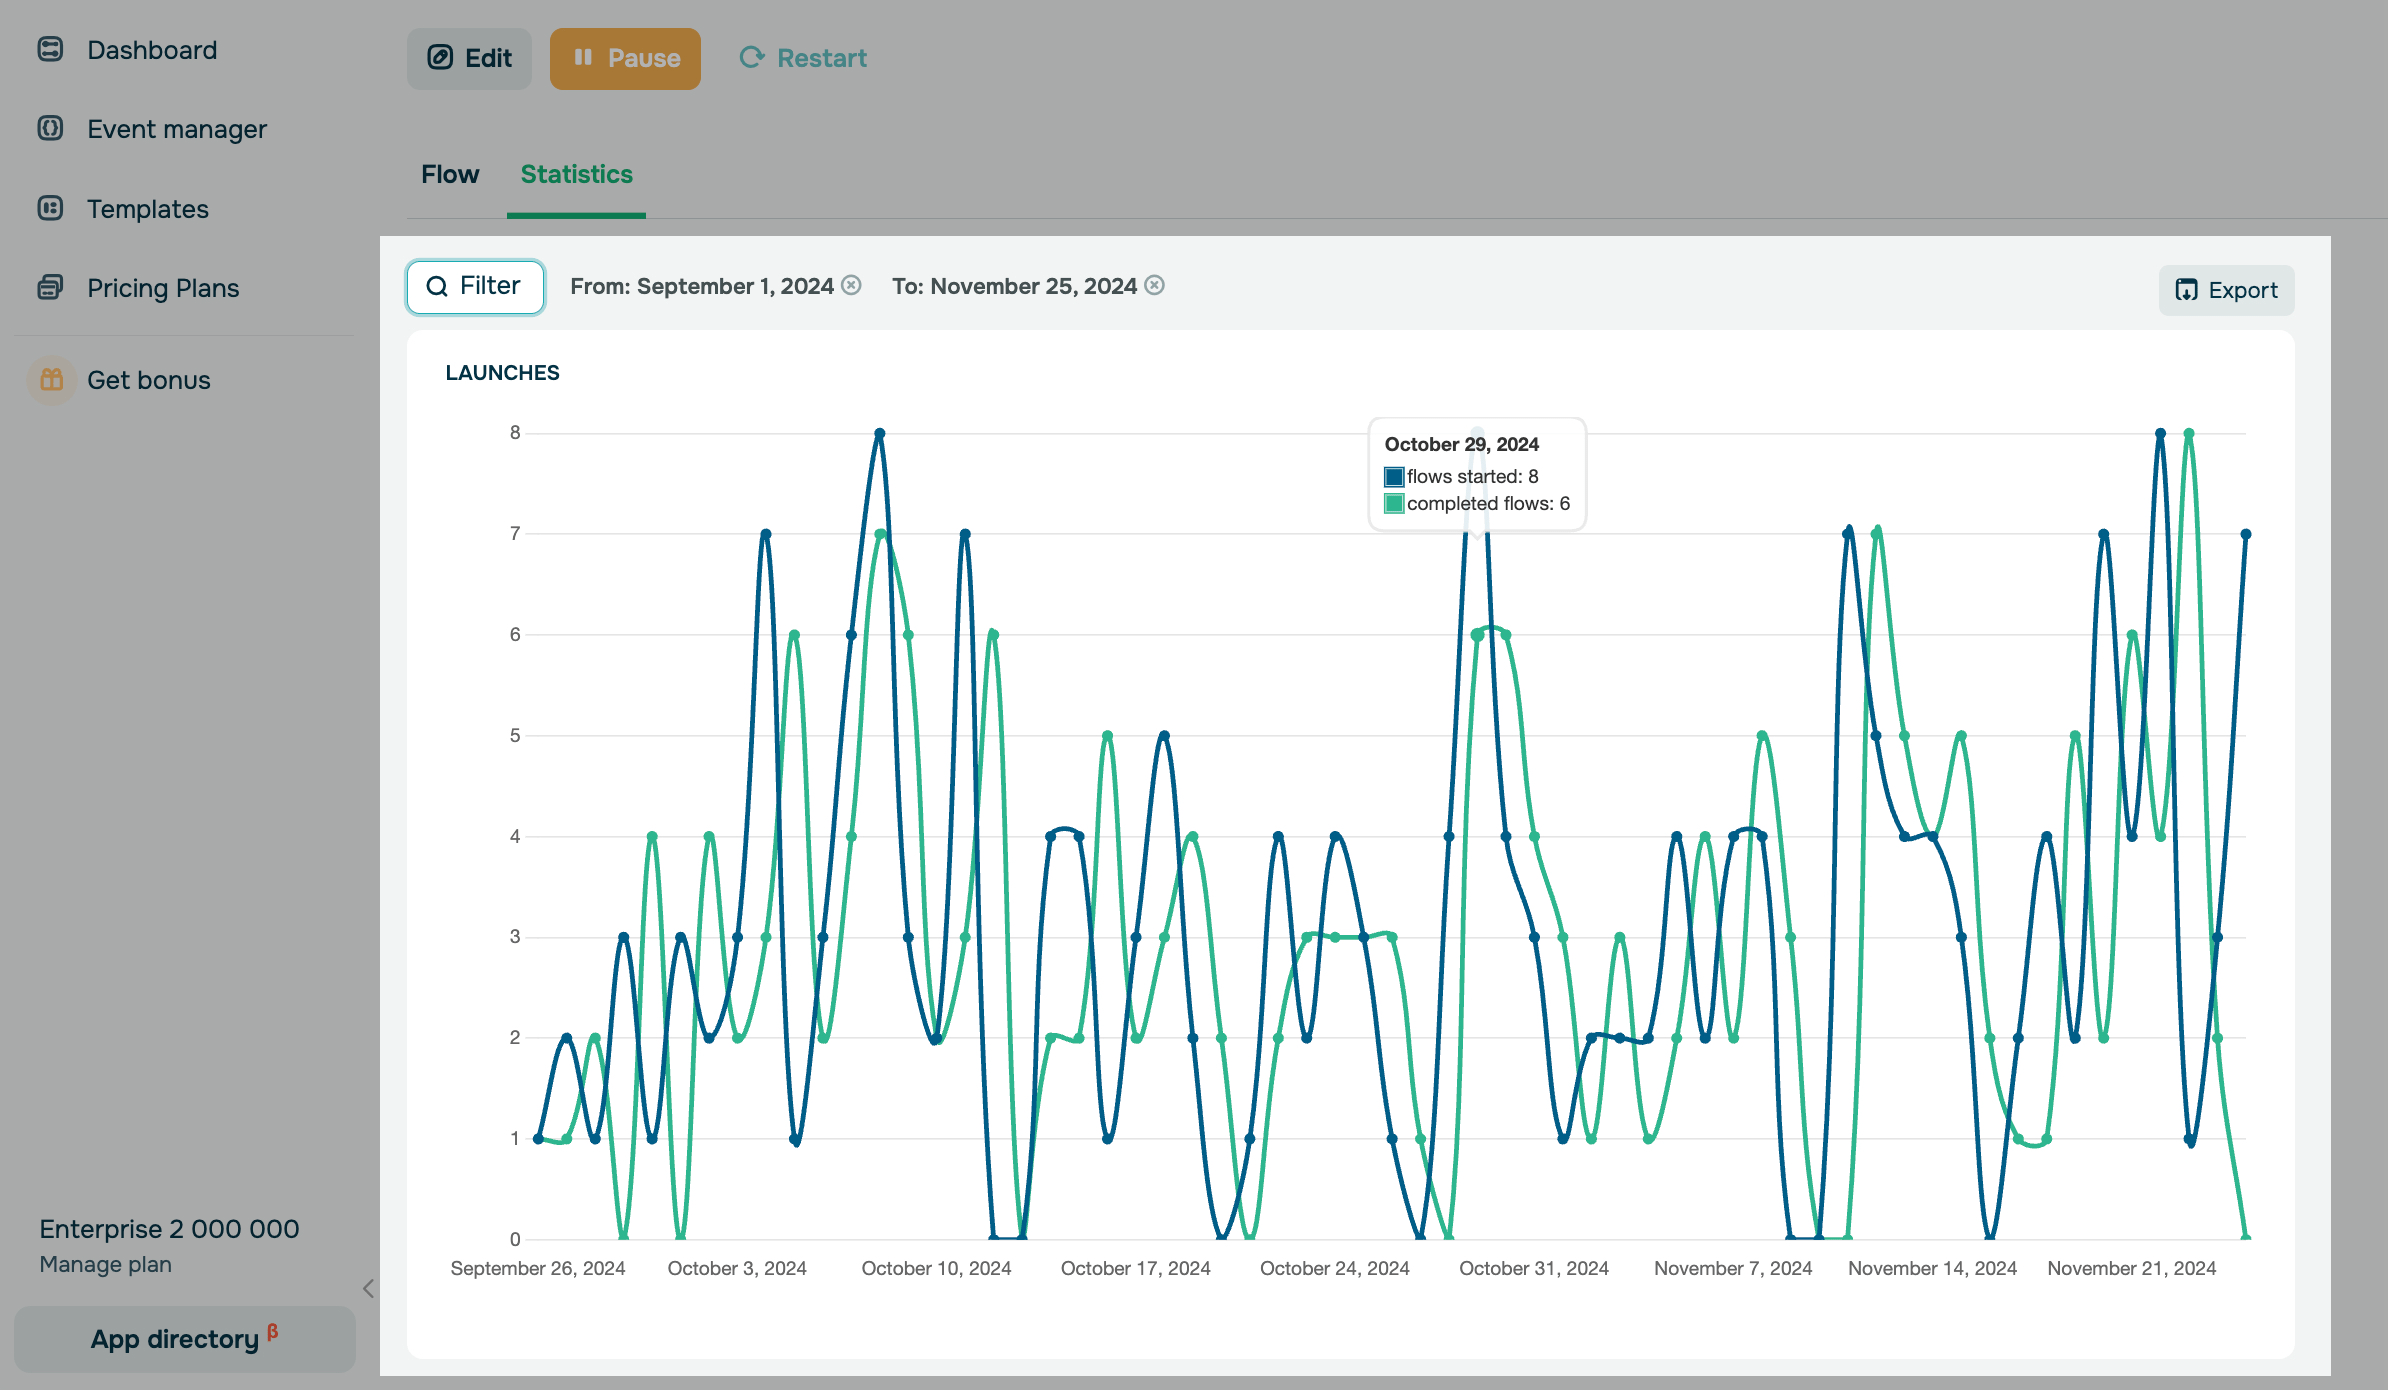
In the Statistics tab, you can view general element statistics (Email, Push, SMS, Viber, Messenger, Action, Condition, and Filter) and the launch and completed series chart.
Chart
The chart displays your flow launch and completed series indicators. Hover over the required chart section to see the exact numbers.
You can view data for a specific period. Click Filter, select the period for which you want to view the statistics, and click OK.
Elements
Automated pipeline elements in the Statistics tab are displayed in the order they were added to your flow. If you edit your flow and add new elements, they will appear at the end of the list.
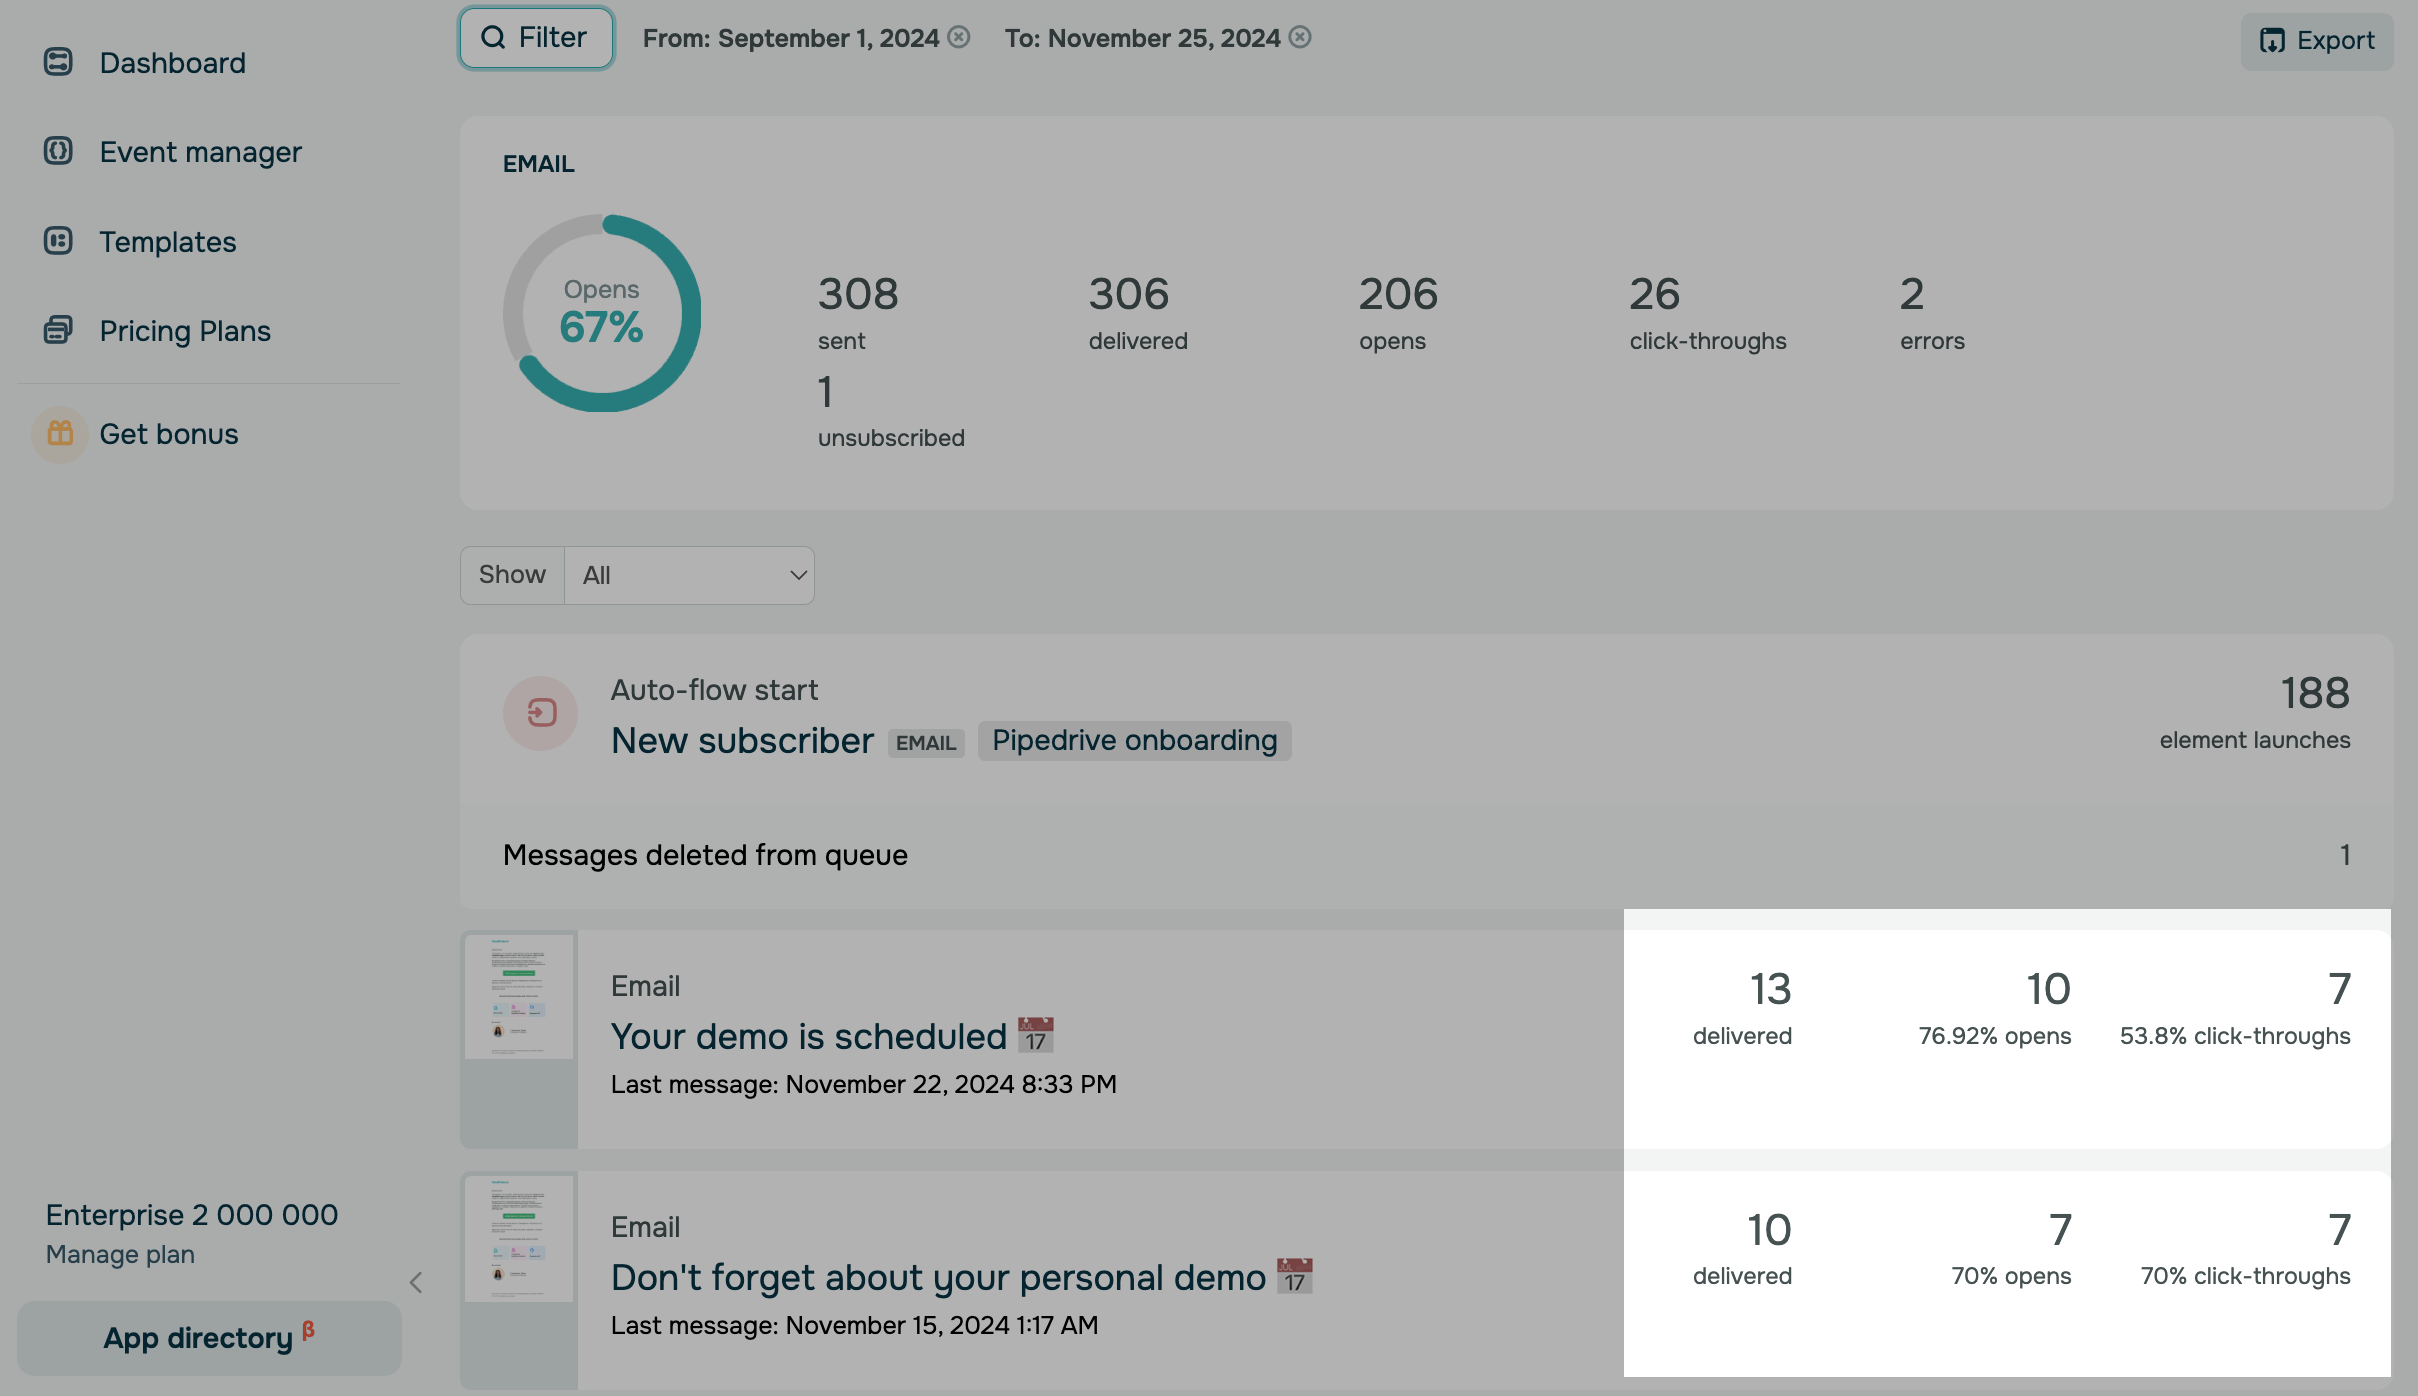
You can also view an infographic with the percentage of sent and opened campaigns. If you have used other elements that trigger campaign sending (Push, Messenger, SMS, and Viber), you will see their statistics, too.
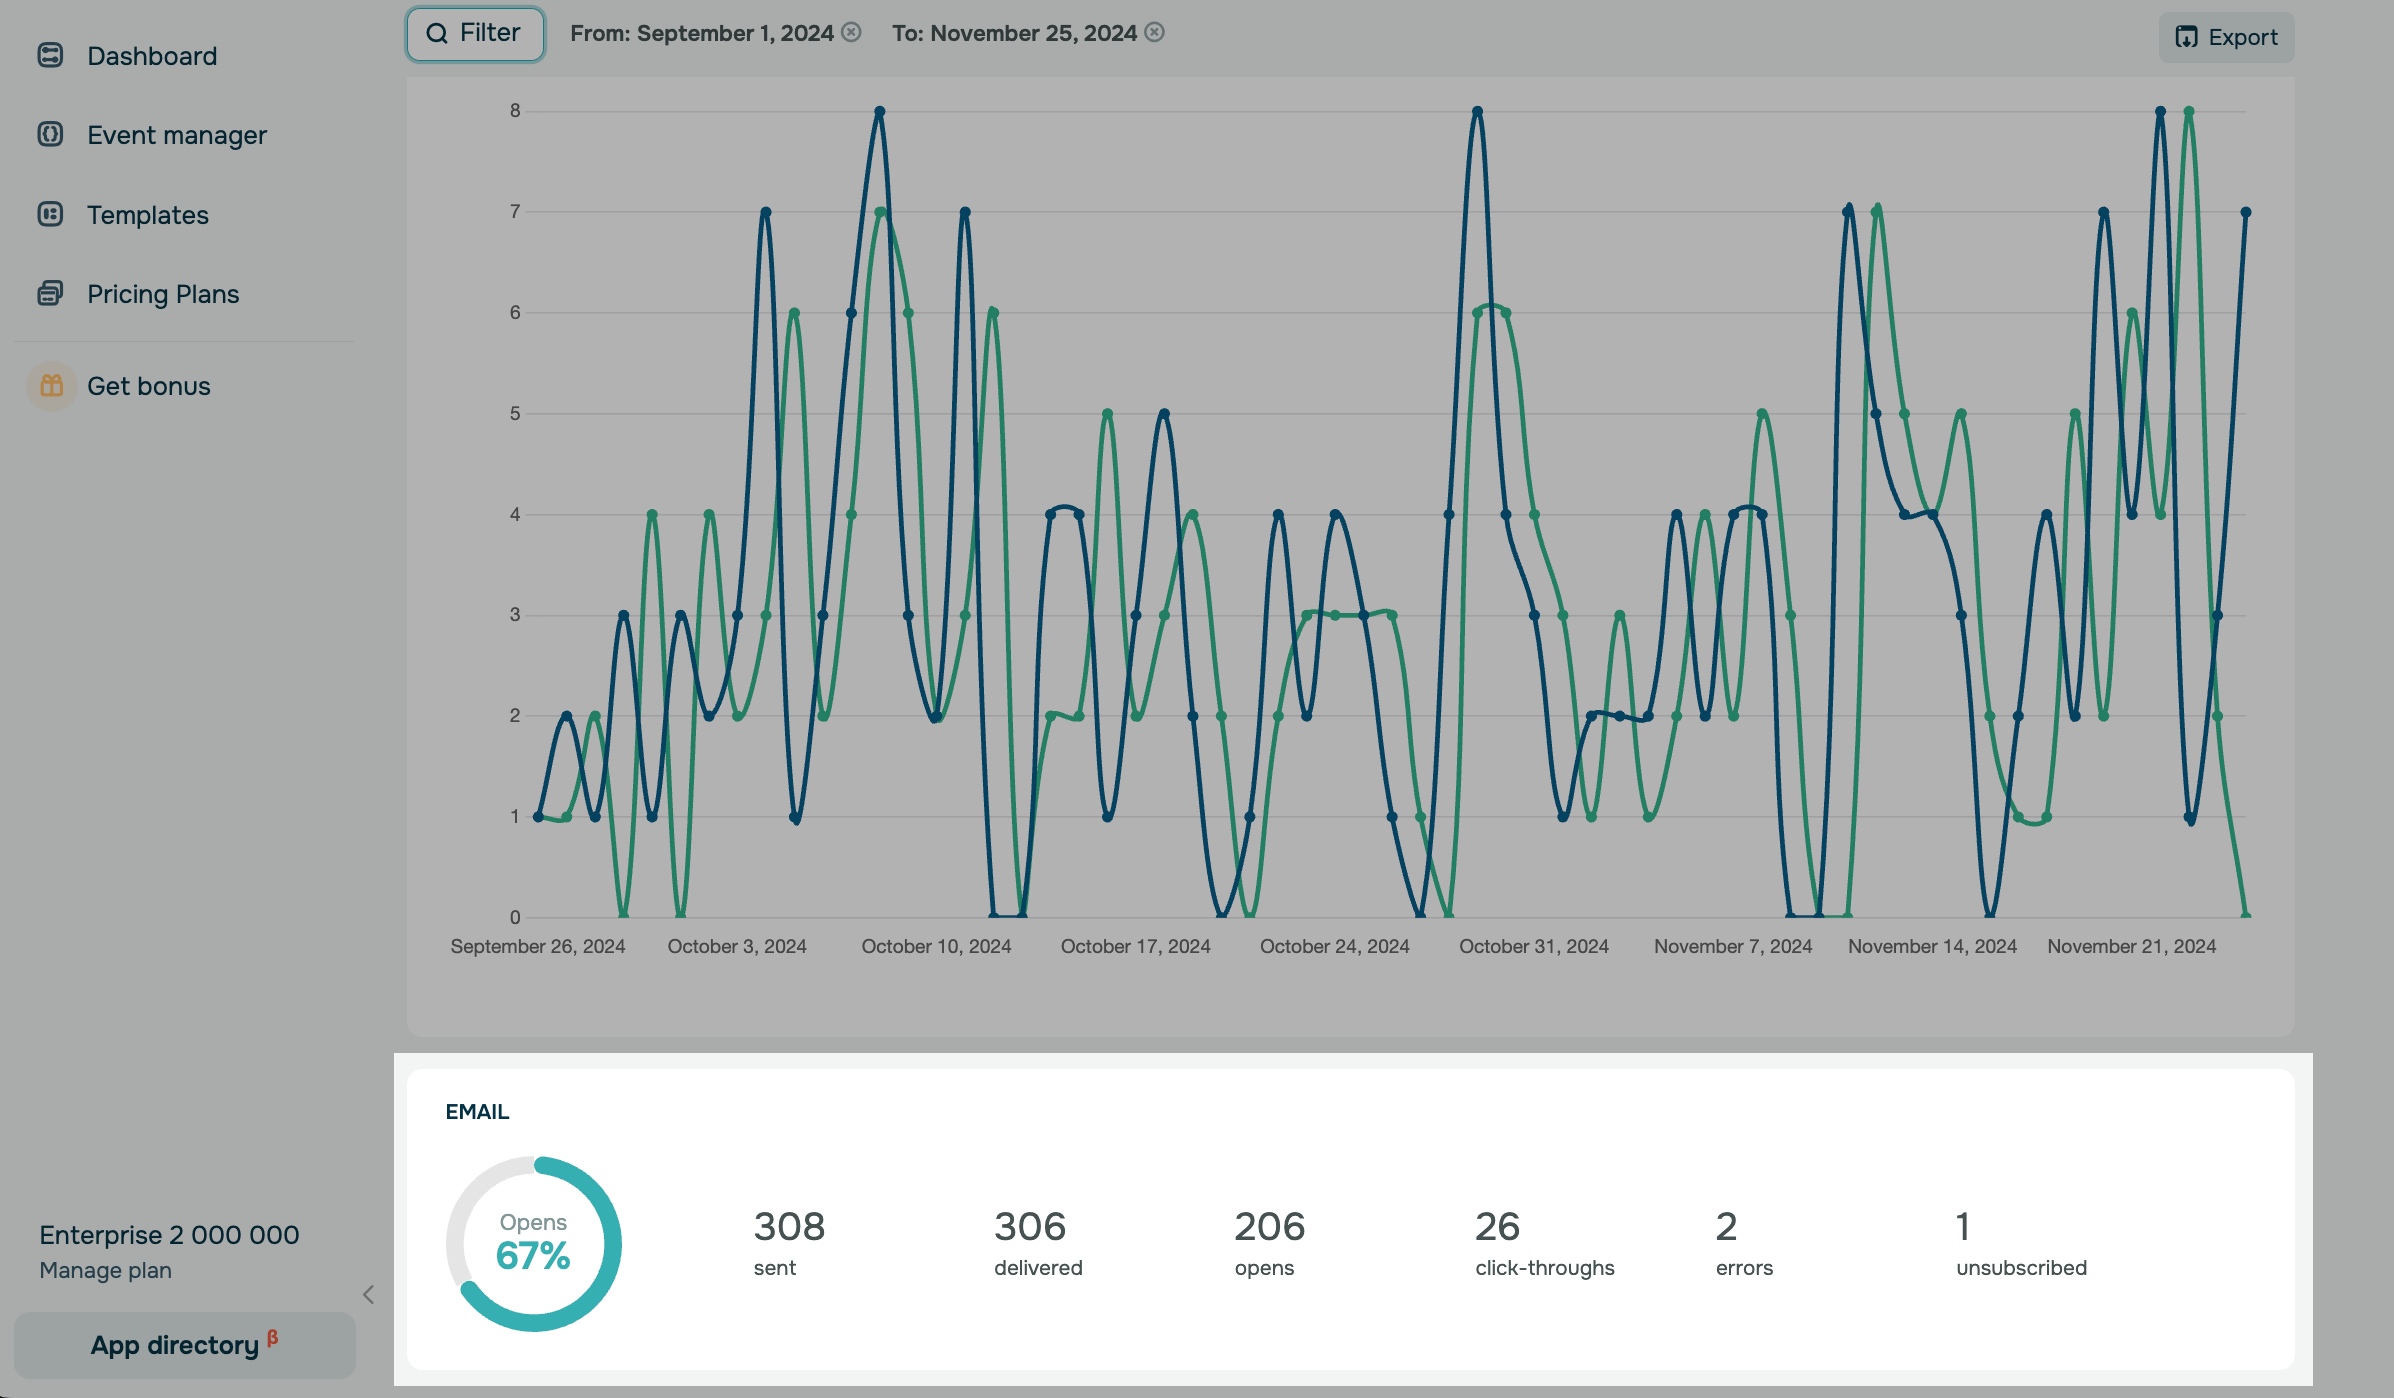
Next to each element, you will see its progress statistics. For example, for the Email element, you can view statistics indicators described in the table below.
| Delivered | The number of subscribers your campaign has been delivered to. |
| Opens | The number of opened campaigns and their percentage ratio to delivered campaigns. |
| Click-throughs | The number and percentage of clicks on links or buttons. |
The following data is displayed for elements:
| SMS | The number of sent and delivered messages and errors. |
| Messenger | The number of contacts who received your campaign. |
| Push | The number of sent and delivered notifications and click-through statistics. |
| Filter, Action, Target, and Condition | The number of element launches. |
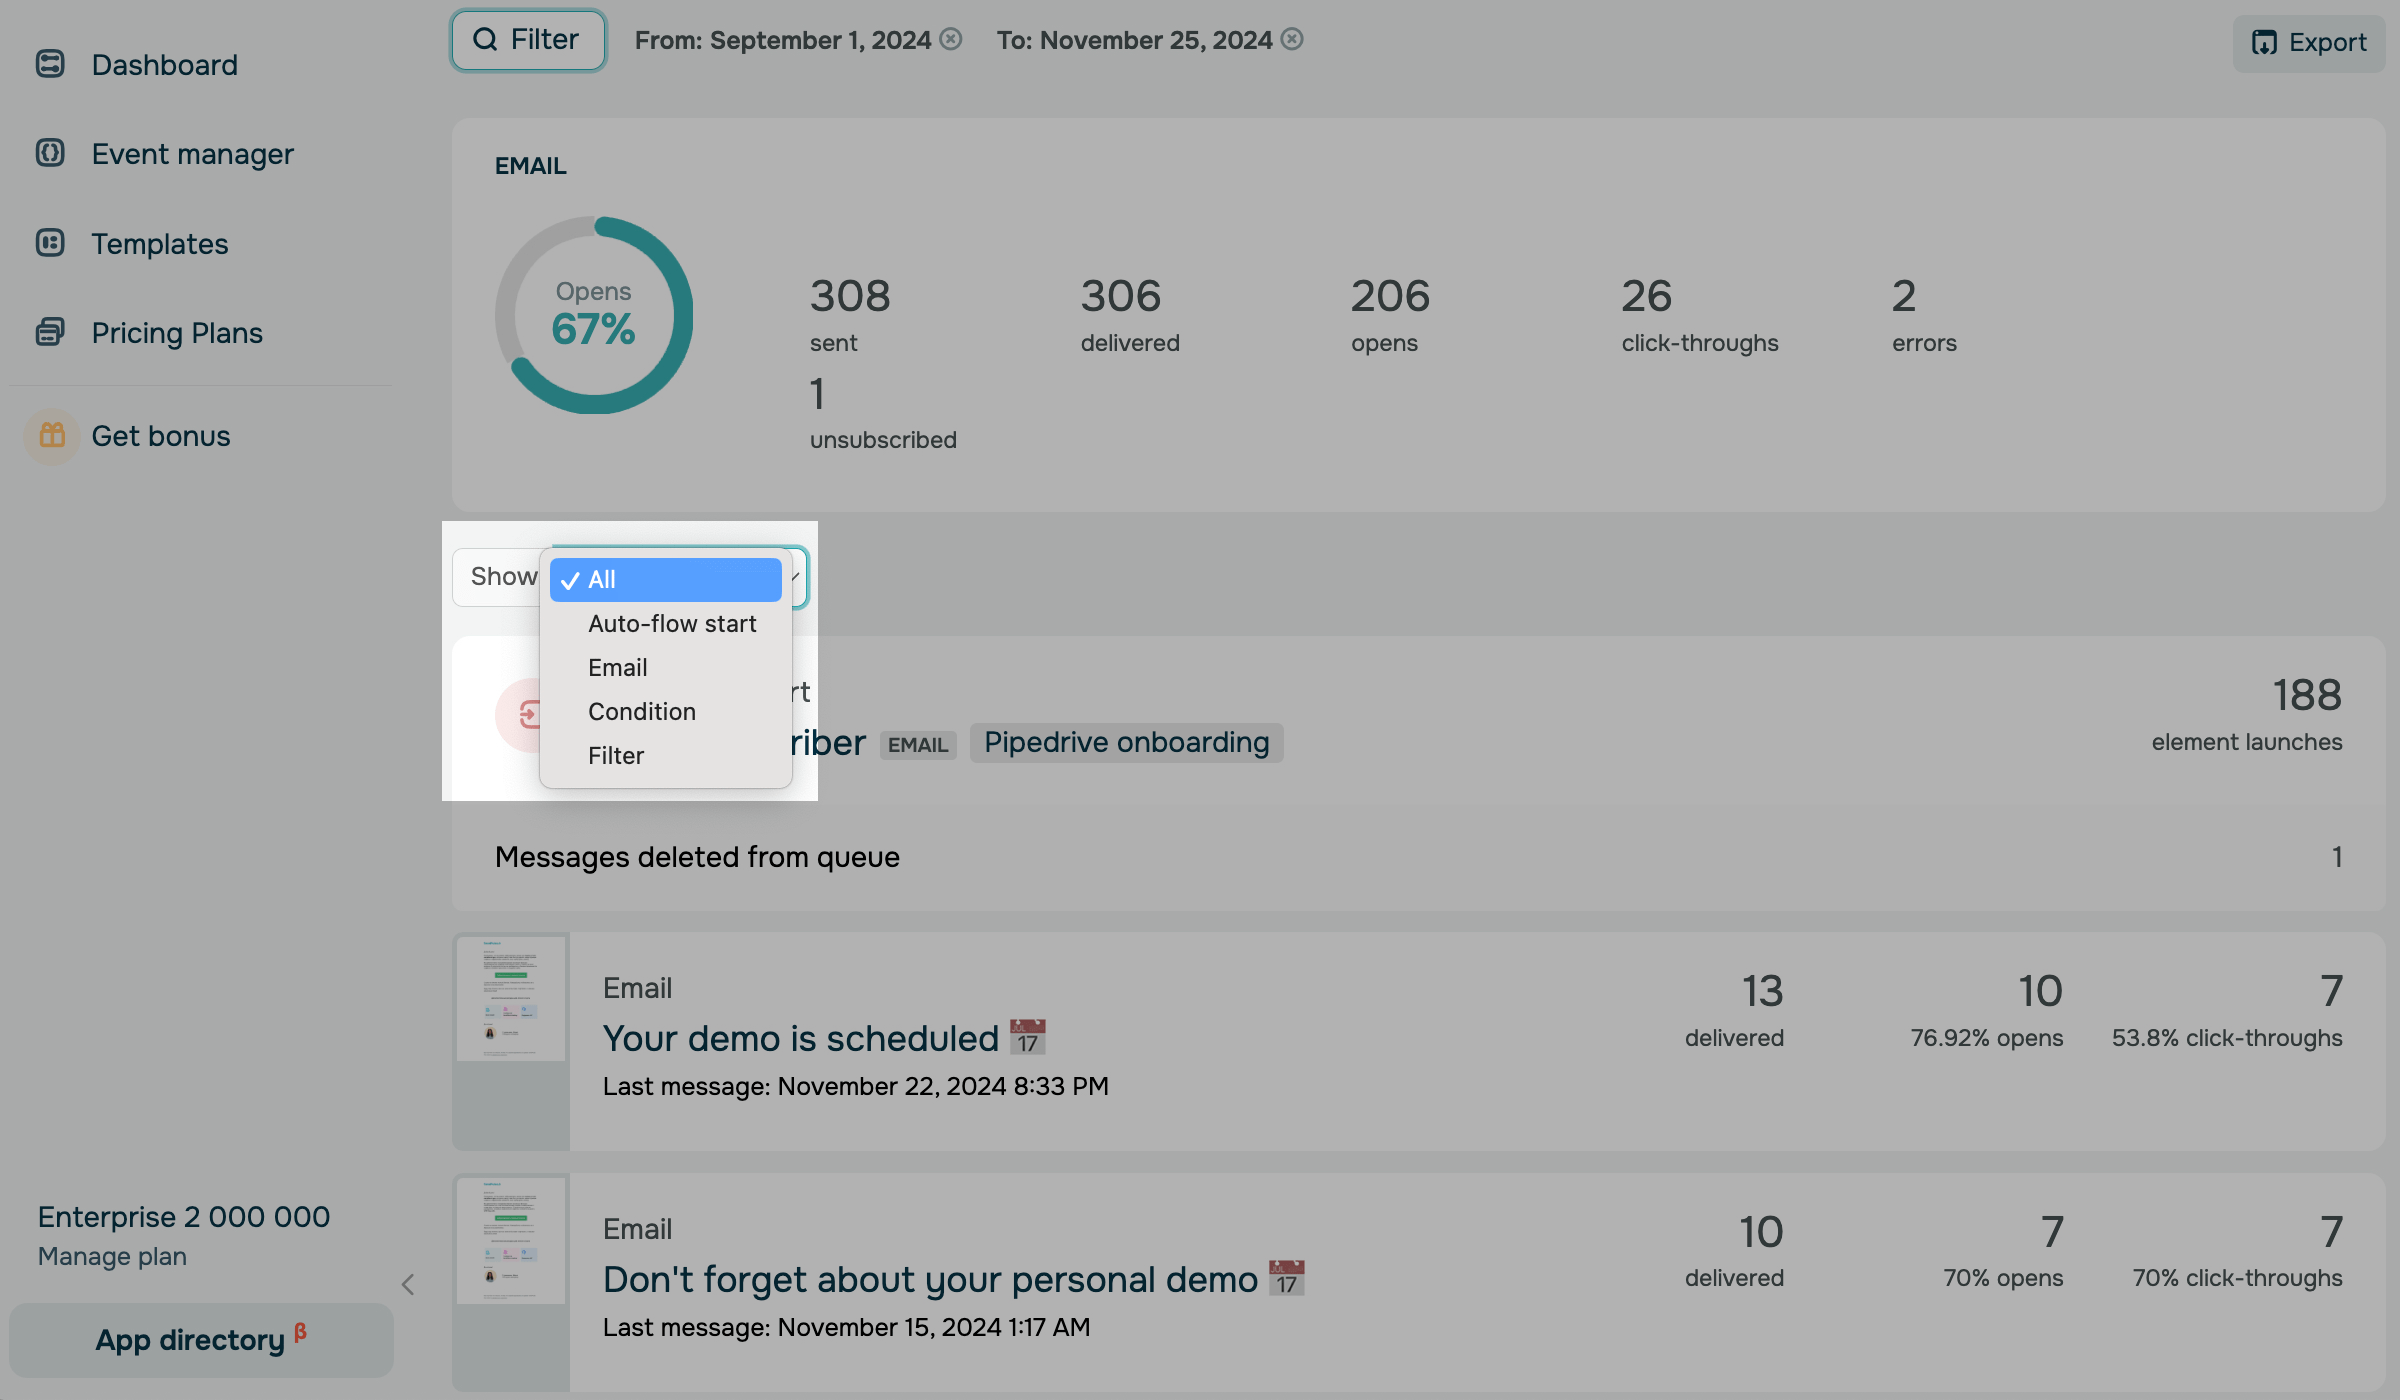
You can view only certain types of automated pipeline elements. Scroll down the Statistics page to the element list. Open the Show drop-down list, and select the elements you want to view.
Element statistics
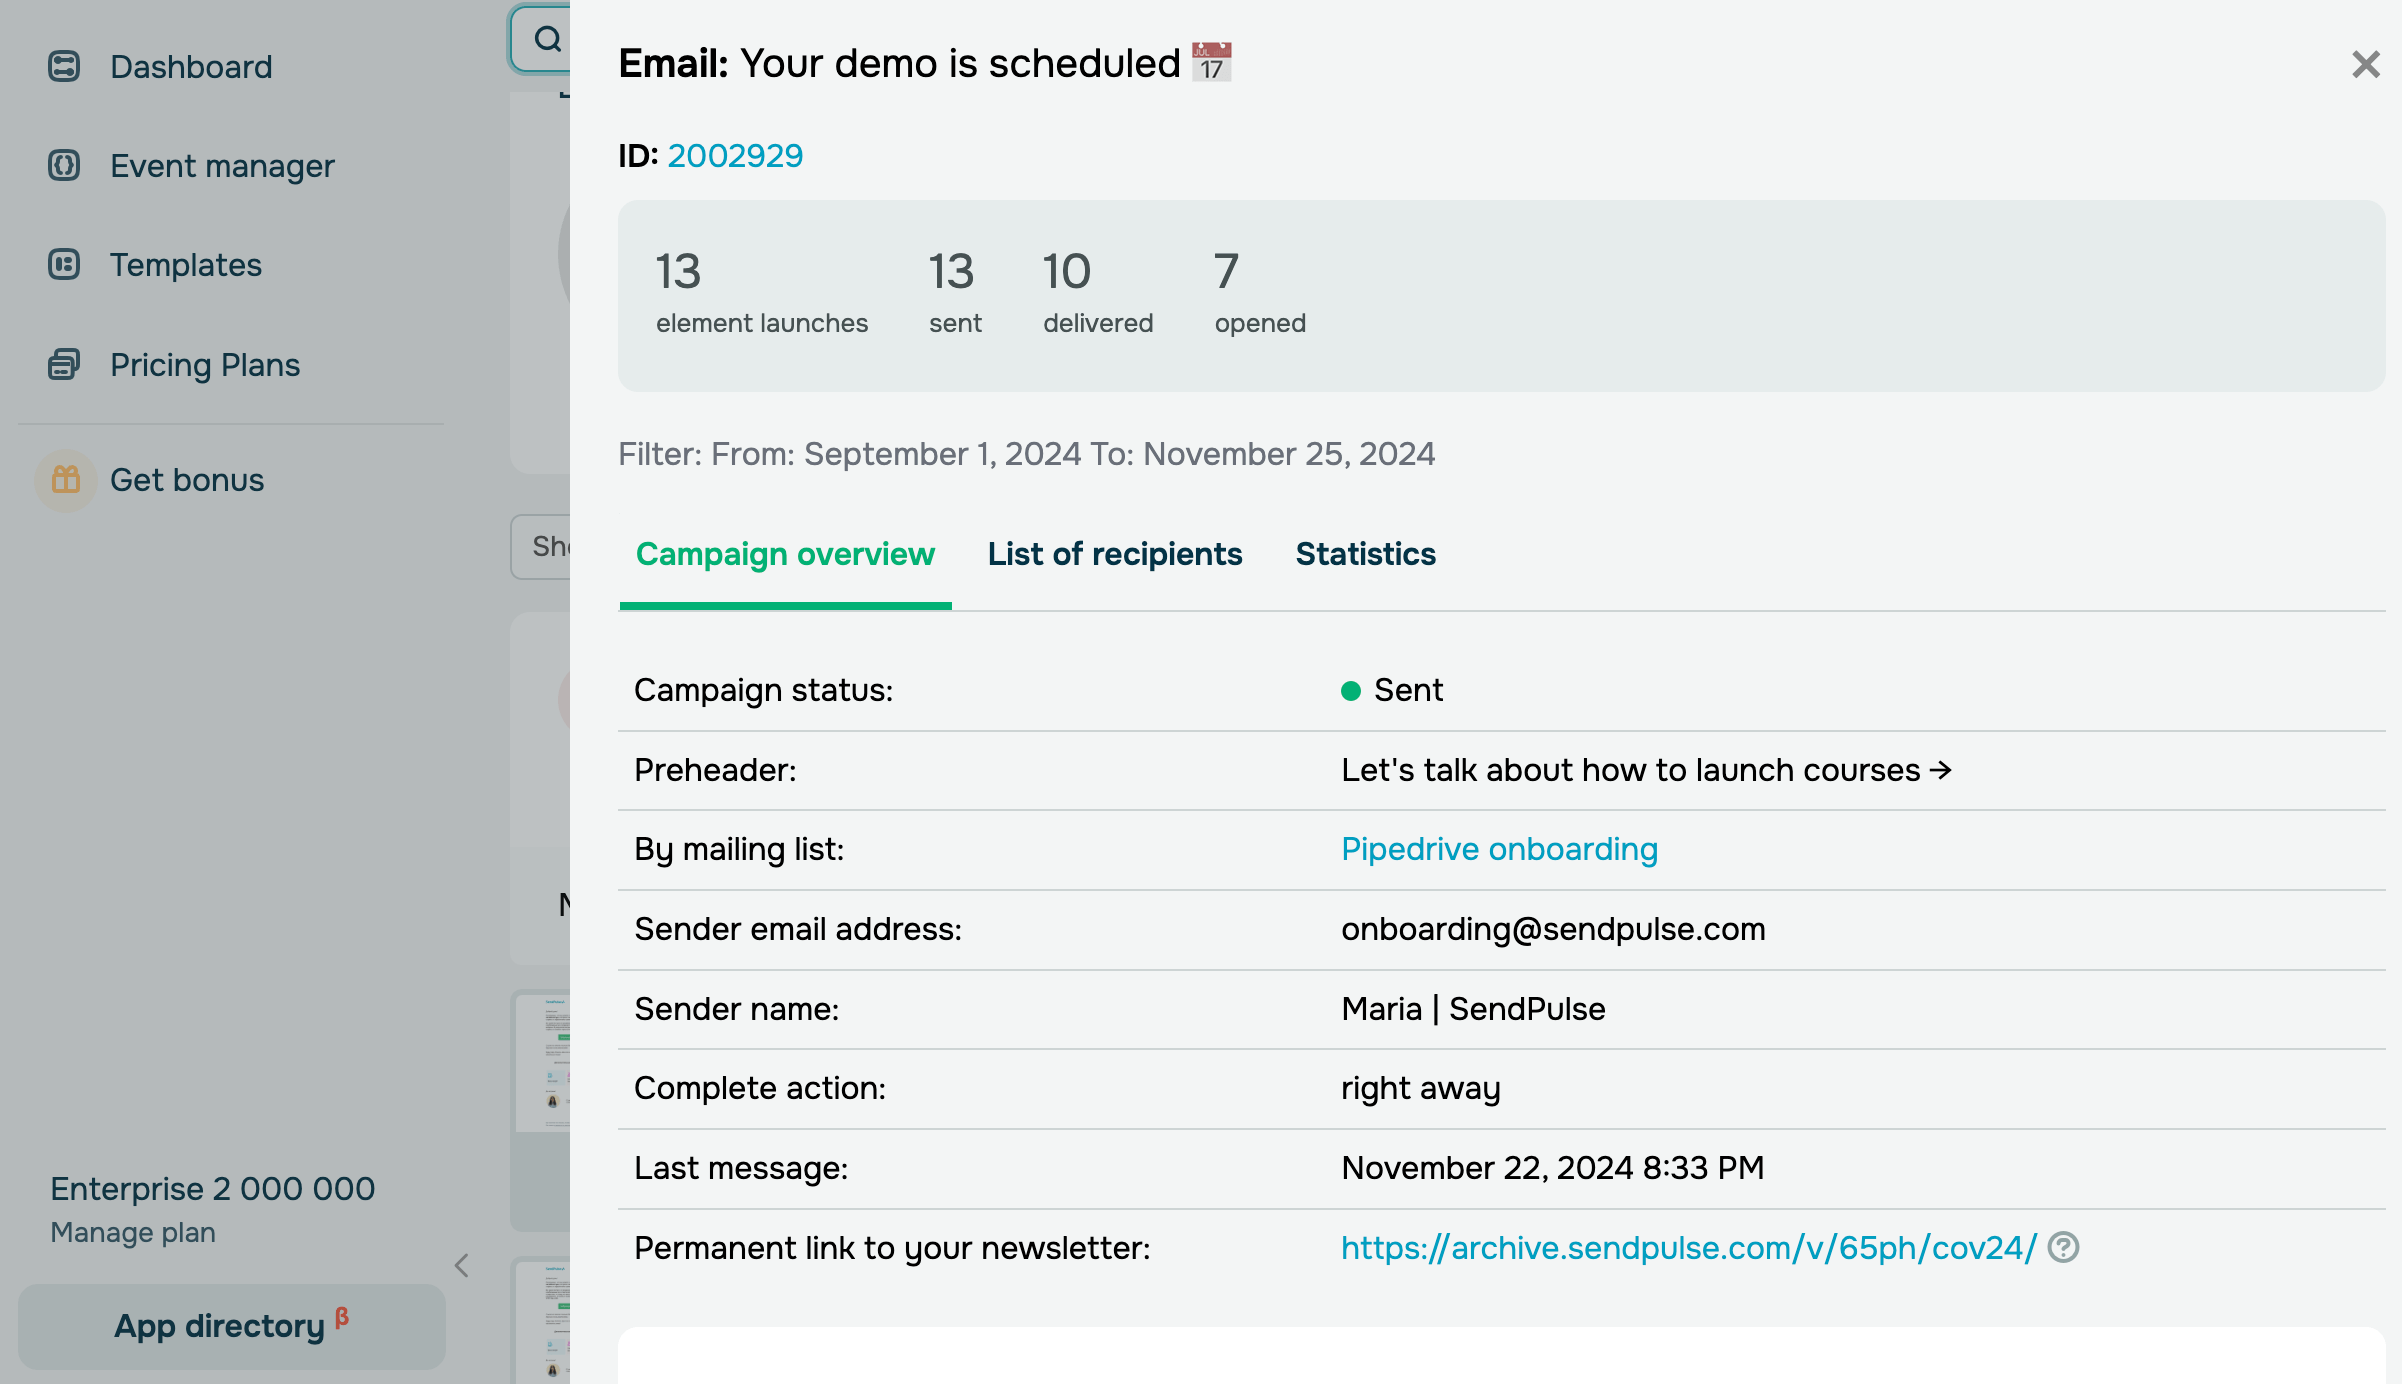
If you click an automation element, a sidebar will be opened. You will see the information about element settings, statistics, and the list of contacts for whom it was launched.
For more detailed information about element statistics, see the articles about each element:
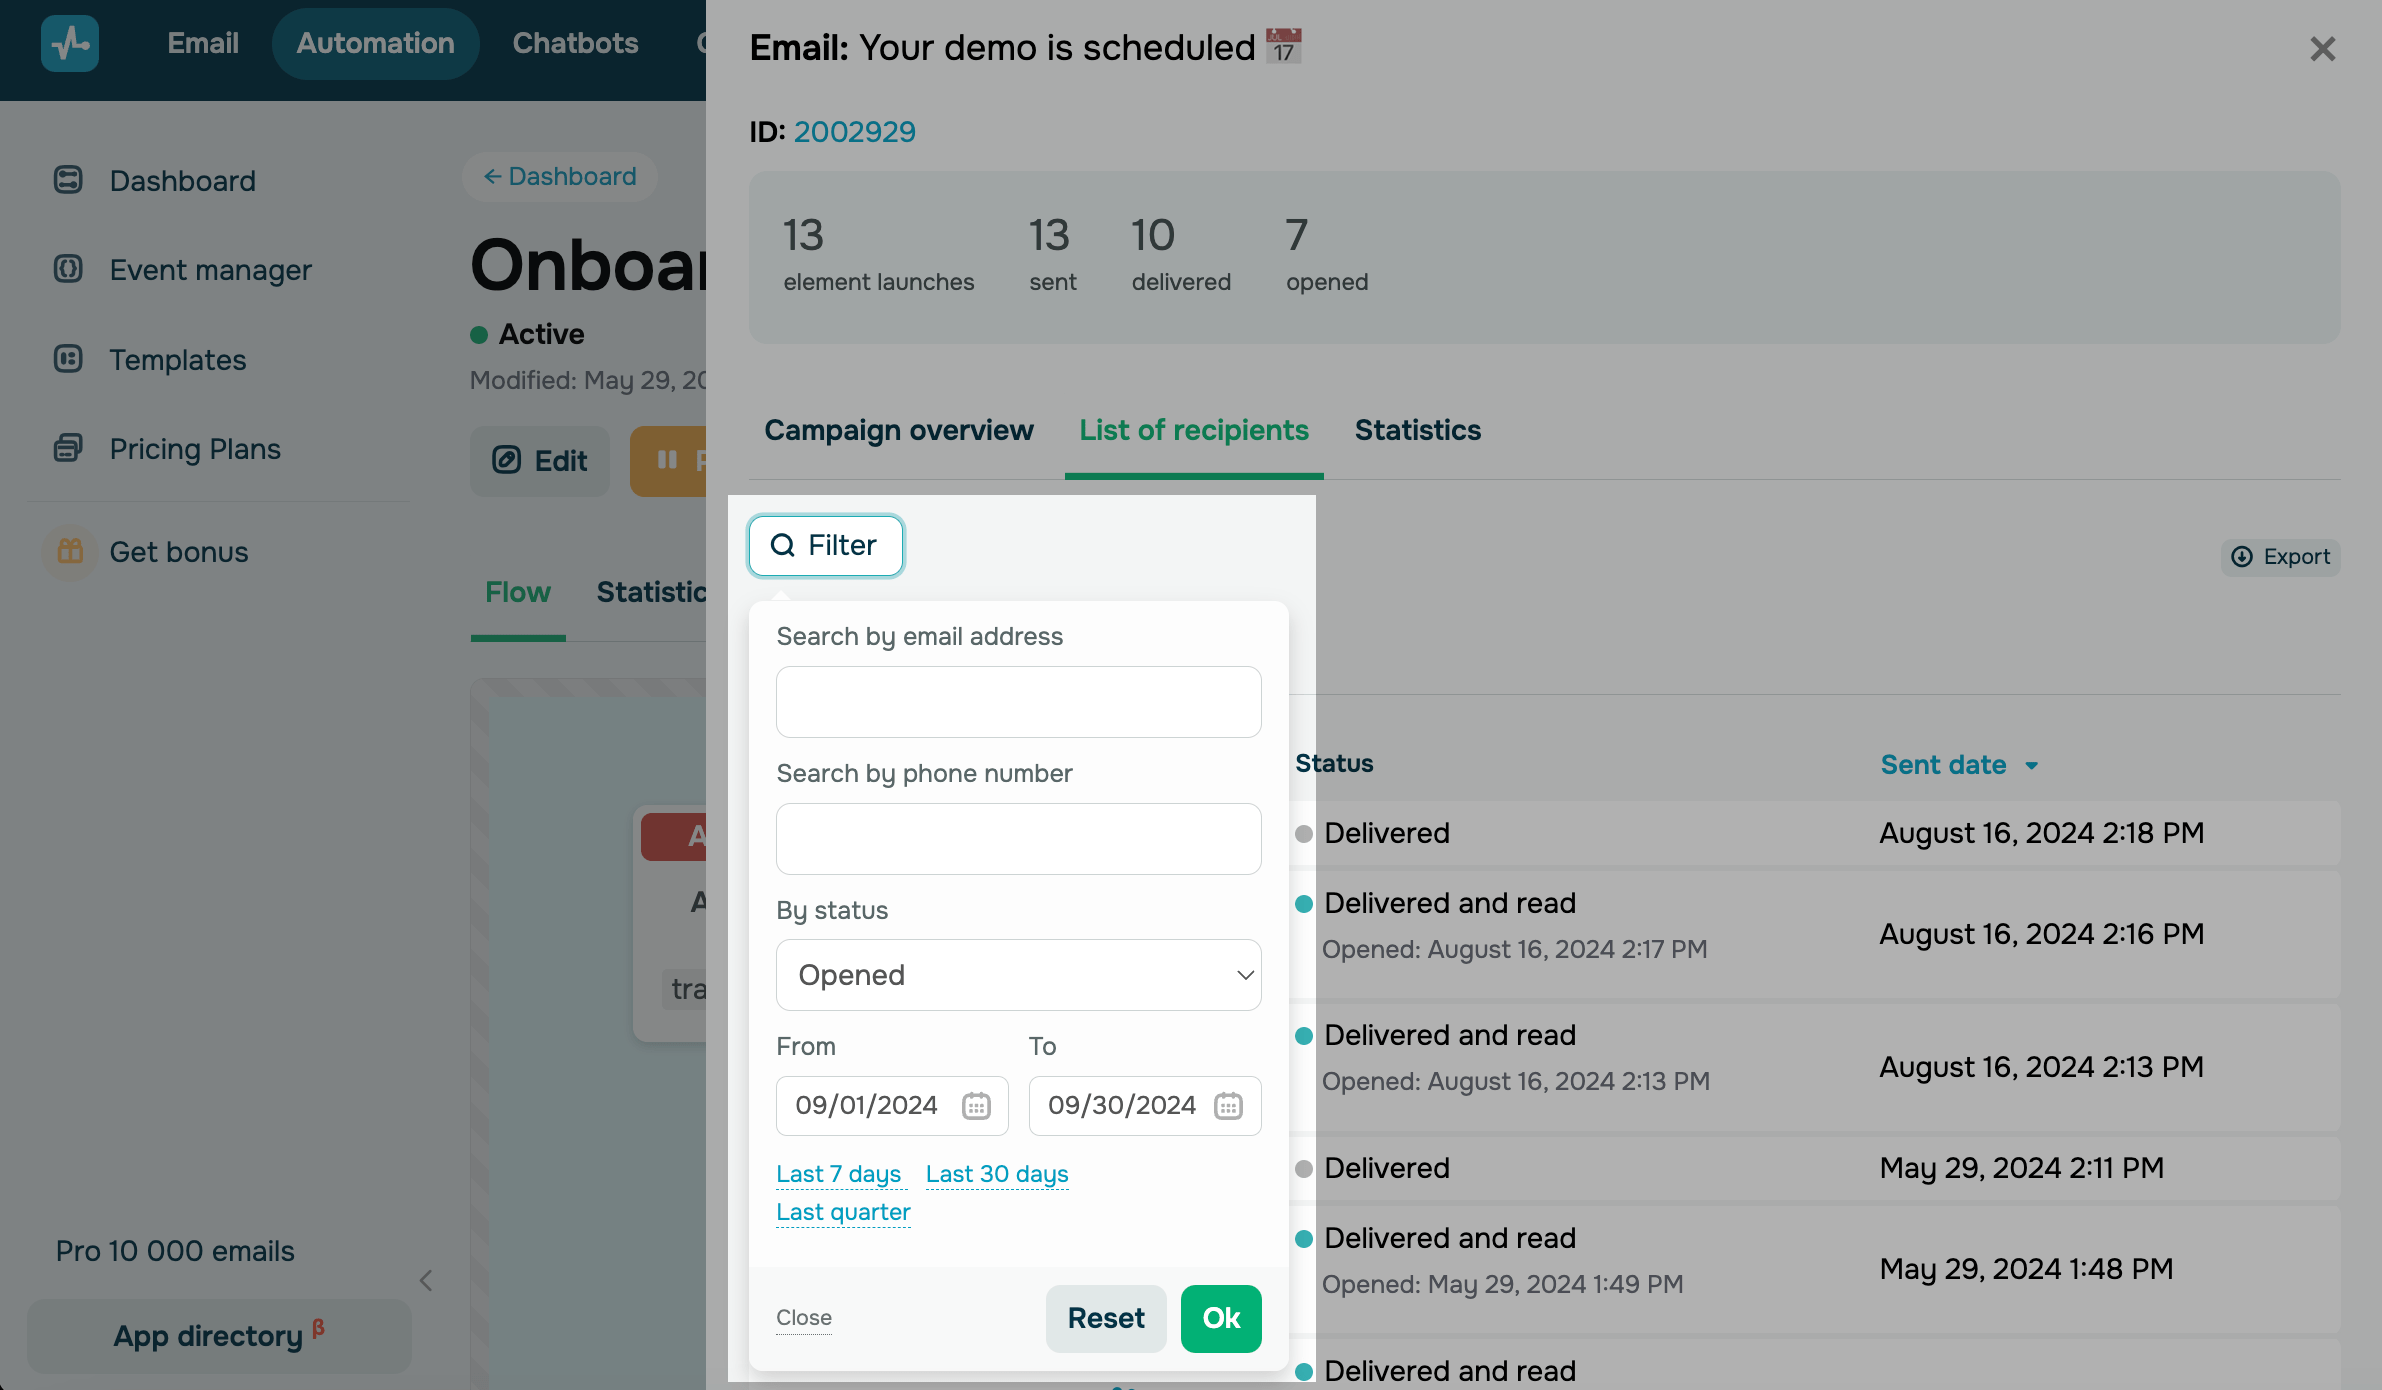
You can filter your recipient list on the element sidebar.
Select the Email element, and go to the List of recipients tab. In the filter, set your criteria, and click Select.
Export data
You can export your general automated statistics and the list of contacts who reached the element.
Read more: How to export automated flow statistics.
Last Updated: 25.06.2024
or